[Preprint]. 2025 Mar 17:2025.03.17.643749.
doi: 10.1101/2025.03.17.643749.

Markov models bridge behavioral strategies and circuit principles facilitating thermoregulation

Affiliations

Markov models bridge behavioral strategies and circuit principles facilitating thermoregulation

Kaarthik Abhinav Balakrishnan et al. bioRxiv. .

Abstract

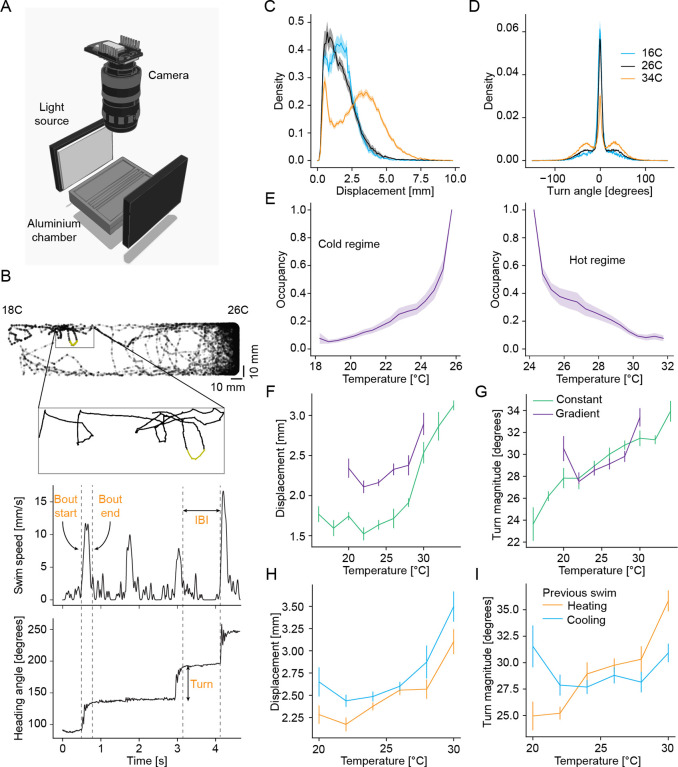
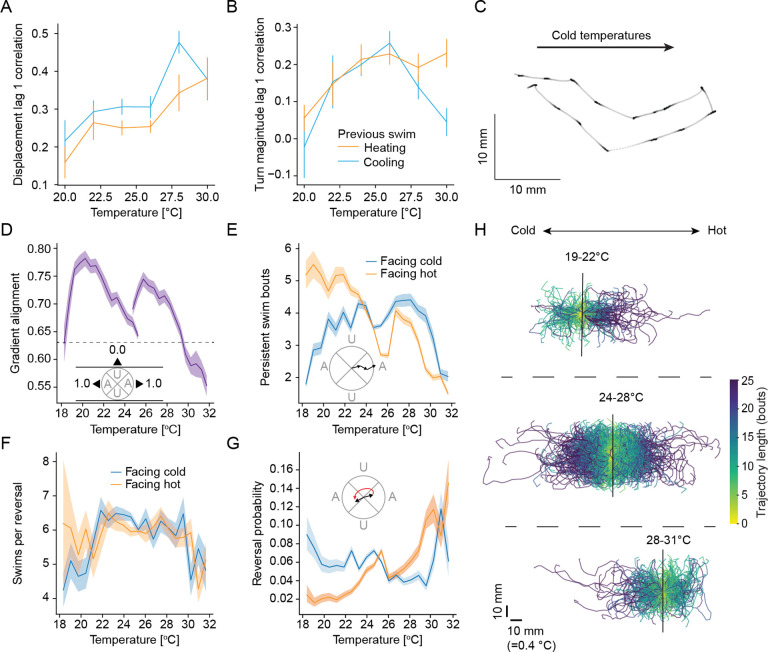
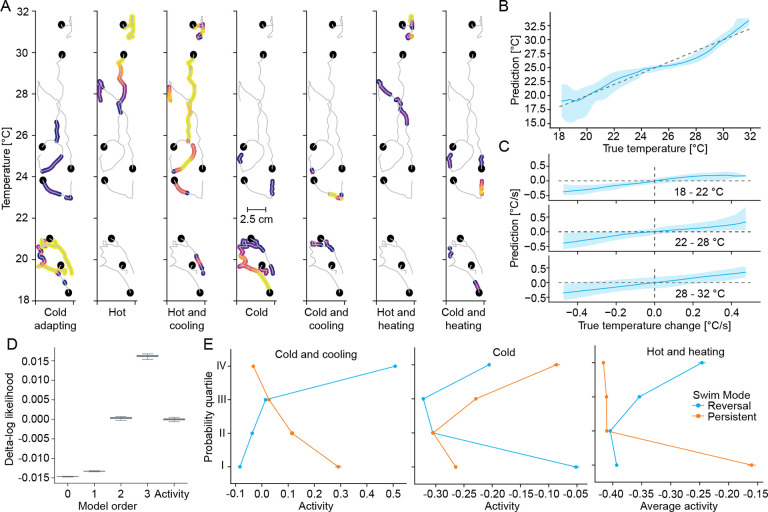
Behavioral thermoregulation is critical for survival across animals, including endothermic mammals. However, we do not understand how neural circuits control navigation towards preferred temperatures. Zebrafish exclusively regulate body temperature via behavior, making them ideal for studying thermal navigation. Here, we combine behavioral analysis, machine learning and calcium imaging to understand how larval zebrafish seek out preferred temperatures within thermal gradients. By developing a stimulus-controlled Markov model of thermal navigation we find that hot avoidance largely relies on the modulation of individual swim decisions. The avoidance of cold temperatures, a particular challenge in ectotherms, however relies on a deliberate strategy combining gradient alignment and directed reversals. Calcium imaging identified neurons within the medulla encoding thermal stimuli that form a place-code like representation of the gradient. Our findings establish a key link between neural activity and thermoregulatory behavior, elucidating the neural basis of how animals seek out preferred temperatures.


Conflict of interest statement

Competing Interests The authors declare that no competing interests exist.

Figures

Figure 1:
Figure 1:
Comparison of bout parameters of larval zebrafish across experimental conditions. A Illustration of the behavioral setup to track fish in a temperature controlled aluminium chamber. B Example tracking of larval zebrafish in an experiment with a highlighted section of the trajectory shown in a zoomed inset; the fish movement in that trajectory (top) is characterized using instantaneous swim speed (middle) and heading angle (bottom), with the definition of bout starts, bout ends, inter-bout intervals and turn angle indicated on the plot. C Example distribution of swim displacements (in mm) at three different temperatures averaged over all corresponding constant temperature experiments (blue- 16 °C, black- 26 °C, orange- 34 °C). D Example distribution of turn angles (in degrees) for the same temperatures as (C). E Occupancy of larval zebrafish in the chamber averaged across all experiments with a temperature gradient in the Cold regime and Hot regime. F Comparison of median swim displacements (in mm) of larval zebrafish with respect to temperature in constant temperature (green) and gradient (purple) experiments. G Comparison of median turn magnitudes (in degrees) of larval zebrafish with respect to temperature in constant temperature (green) and gradient (purple) experiments. H Comparison of median swim displacements of larval zebrafish at each temperature for different contexts in gradient experiments-orange- heating context, blue- cooling context. I Comparison of median absolute turn magnitude of larval zebrafish at each temperature for different contexts in gradient experiment-sorange- heating context, blue- cooling context. All error bars and shaded error regions are bootstrap standard errors across experiments.
Figure 2:
Figure 2:
Simulation of non-parametric model of navigation based on experimental distribution of bout parameters shows cold avoidance. A Schematic of simulation of fish in a virtual gradient with bout movements picked from binned values of constant temperature experiments. B-C Comparison of occupancy of fish in gradient temperature experiments (purple) and simulations using the non-parametric model (orange) binned from constant temperature experiments in the cold (B) and hot (C) regime. Black dashed line indicates uniform distribution of a randomly moving particle. DKL indicates KL divergence between simulations as well as the uniform distribution and the fish data. D Schematic of simulation of fish in a virtual gradient with bout movements picked from gradient temperature experiments, binned according to temperature and temperature change. E-F Same as (B-C) using the nonparametric temperature/temperature change simulation.
Figure 3:
Figure 3:
Larval zebrafish modulate gradient alignment, persistent swims and reversals to aid navigation. A Autocorrelation of displacement in consecutive swims at different temperatures in different contexts- heating (orange) and cooling (blue). B Autocorrelation of absolute turn magnitude in consecutive swims at different temperatures in different contexts- heating (orange) and cooling (blue). C Example experimental trajectory of cold avoidance in larval zebrafish showing gradient aligned swimming and a reversal maneuver. D Alignment of larval zebrafish with the gradient direction at different temperatures in hot and cold regimes compared to a random gradient alignment (black dotted line); inset figure shows the definition of the cones of alignment with gradient direction. E Average number of swim bouts in persistent trajectories starting at different temperatures under different contexts- facing hot direction (orange) and facing cold direction (blue); inset figure illustrates the definition of a persistent trajectory. F Average number of swim bouts in reversal manuevers starting at different temperatures under different contexts- facing hot direction (orange) and facing cold direction (blue). G Probability of initiating a reversal on trajectories starting at different temperatures under different contexts- facing hot direction (orange) and facing cold direction (blue); inset figure shows the definition of a reversal trajectory. H Examples of trajectories until initiation of a reversal from gradient experiments with the larval zebrafish starting at different temperatures (black lines); colorbar represents number of swim bouts until reversal start. All error bars and shaded error regions are bootstrap standard errors across experiments.
Figure 4:
Figure 4:
Modeling larval zebrafish behavior using Markov models highlights the effect of temperature and change in temperature (context) on swim modes. A Schematic of Markov model to describe larval zebrafish movements, with transition probabilities between different modes being controlled by a GLM that depends on previous temperature and change in temperature; followed by emission probabilities controlled by a GLM that depends on temperature, previous temperature and behavioral history (previous displacement for displacement emissions and previous turn for turn emissions). B Example distribution of GLM parameters, normalized according to the standard deviation of the quantity the parameter acts on, obtained from Monte Carlo fits for the reversal-to-reversal transition probability. Note that each violin plot encompasses 4000 draws from the posterior distribution. C Scatter plot of GLM parameters related to TΔT2 and ΔT3 showing a strong correlation (r = 0.8). D Comparison of goodness of fit of transition models of different orders using log-likelihood of model predictions on test-data, with the chance model which uses the overall data distribution for predictions. E Heatmap of steady state probabilities of the reversal mode depending on temperature and change in temperature for the 3rd order model. F Heatmap of steady state probabilities of the persistent mode depending on temperature and change in temperature for the 3rd order model. G Dependence of emission of turn angle on the previous turn in the persistent mode - previous left turn (blue), previous straight swim (black dotted) and previous right turn (orange). H Same as (G) for reversal mode.
Figure 5:
Figure 5:
Simulation of fish behavior using a parametric Navigation model reveals the importance of nonlinear control of transitions for cold avoidance. A Schematic of simulation of larval zebrafish in a virtual gradient using the Navigation model to generate a new state, followed by emission of bout parameters- IBI, displacement and turn angle. B Comparison of occupancy of fish (purple dotted) in the cold regime and simulation using the parametric Navigation model for different orders including KL-divergences. C Comparison of occupancy of fish (purple dotted) in the hot regime and simulation using the parametric Navigation model for different orders including KL-divergences D Comparison of KL divergence for simulations using transition models of increasing order (black dotted lines represent KL divergence of a random model that does not have any temperature dependence of bout parameters) in the cold regiome (blue) and hot regime (red). E Comparison of tracked trajectories of larval zebrafish in a cold gradient (18 °C to 26 °C) and a hot gradient (24 °C to 32 °C) with a simulated experiment using the Navigation model with a 3rd order transition model.
Figure 6:
Figure 6:
Calcium imaging reveals stimulus segregation across seven response types. A Schematic of experimental setup for functional imaging of neurons in the medulla and trigeminal using a custom flow-based setup to temperature-control head-fixed larval zebrafish. B Calcium activity of example neurons in identified clusters of temperature responsive neurons in the medulla, clustered according to response correlation. C Number of neurons in each identified cluster in the medulla across all experiments. D-F Clustered averages of calcium activity of each cluster in the medulla, with the presented temperature stimulus (dotted black line). G Same as (B) for neurons in the Trigeminal ganglion. H Number of neurons identified in each cluster in the trigeminal ganglion. I Clustered averages of calcium activity of each cluster in the trigeminal ganglion, with the presented temperature stimulus (dotted black line). All shaded error regions are bootstrap standard errors across neurons.
Figure 7:
Figure 7:
Predicted activity of medullary response types uncovers their role in encoding position and direction within the gradient. A For each of the seven response types activity is thresholded along the same set of example trajectories (grey, start of trajectory marked by black dot). Above threshold activity is color coded from 0.5 standard deviations above threshold (dark purple) to 3 standard deviations above threshold (yellow). B Comparison of actual temperature of fish with the gradient temperature predicted from a linear combination of predicted neural activity of medullary response types. C Comparison of actual change in temperature of fish with the predicted temperature change from a linear combination of predicted neural activity of medullary response types at different temperatures within the gradient. D Comparison of goodness of fit of models of different orders and an activity-based model, using the difference in log-likelihood of model predictions on test-data relative to the average of the 2nd order transition model. E Influence of activity of neuron type on steady state probabilities of the reversal (blue) and persistent mode (orange). All shaded error regions are bootstrap standard errors across experiments.

References

    1. Simon H. B. Hyperthermia. N. Engl. J. Med. 329, 483–487 (1993). - PubMed
    1. Matsui T., Ishikawa T., Takeuchi H., Tsukahara M. & Maekawa T. Mild hypothermia inhibits IL-10 production in peripheral blood mononuclear cells. Acta Anaesthesiol. Scand. 48, 205–210 (2004). - PubMed
    1. Murray N. M., Buchanan G. F. & Richerson G. B. Insomnia caused by serotonin depletion is due to hypothermia. Sleep 38, 1985–1993 (2015). - PMC - PubMed
    1. Wood T. & Thoresen M. Physiological responses to hypothermia. Semin. Fetal Neonatal Med. 20, 87–96 (2015). - PubMed
    1. Bogert C. M. Thermoregulation in reptiles, a factor in evolution. Evolution 3, 195–211 (1949). - PubMed

Publication types

LinkOut - more resources