[Preprint]. 2025 Mar 19:2025.03.19.643996.
doi: 10.1101/2025.03.19.643996.

ABHD11 inhibition drives sterol metabolism to modulate T cell effector function and alleviate autoimmunity

Affiliations

ABHD11 inhibition drives sterol metabolism to modulate T cell effector function and alleviate autoimmunity

Benjamin J Jenkins et al. bioRxiv. .

Abstract

Chronic inflammation in autoimmunity is driven by T cell hyperactivation. This unregulated response to self is fuelled by heightened metabolic programmes, which offers a promising new direction to uncover novel treatment strategies. α/β-hydrolase domain-containing protein 11 (ABHD11) is a mitochondrial hydrolase that maintains the catalytic function of α-ketoglutarate dehydrogenase (α-KGDH), and its expression in CD4+ T cells has been linked to remission status in rheumatoid arthritis (RA). However, the importance of ABHD11 in regulating T cell metabolism and function - and thus, the downstream implication for autoimmunity - is yet to be explored. Here, we show that pharmacological inhibition of ABHD11 dampens cytokine production by human and mouse T cells. Mechanistically, the anti-inflammatory effects of ABHD11 inhibition are attributed to increased 24,25-epoxycholesterol (24,25-EC) biosynthesis and subsequent liver X receptor (LXR) activation, which arise from a compromised TCA cycle. The impaired cytokine profile established by ABHD11 inhibition is extended to two patient cohorts of autoimmunity. Importantly, using a murine model of accelerated type 1 diabetes (T1D), we show that targeting ABHD11 suppresses cytokine production in antigen-specific T cells and delays the onset of diabetes in vivo. Collectively, our work provides pre-clinical evidence that ABHD11 is an encouraging drug target in T cell-mediated autoimmunity.


Conflict of interest statement

Competing Interests M. Niphakis is an employee of Lundbeck. All authors declare no competing interests.

Figures

Figure 1.
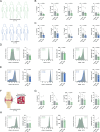
Figure 1.. ABHD11 inhibition impairs T cell activation and cytokine production.
(A) ABHD11 expression in CD4+ T cells, unstimulated or activated with α-CD3 and α-CD28 (n = 3). Protein loading assessed using β-actin. (B) IL-2, IL-10, IL-17, IFNγ and TNFα production by CD4+ effector T cells (n = 9/10). (C) qPCR analysis of IL17 and IFNG expression in CD4+ effector T cells (n = 6). (D) Surface expression of CD69 as a measure of activation, as measured by flow cytometry, on CD4+ effector T cells (n = 5). (E) Cell size, as determined by forward scatter area, of CD4+ effector T cells (n = 5). (F) Intracellular IFNγ expression, as measured by flow cytometry, in murine CD4+ effector T cells following polarisation towards Th1 in the presence and absence of WWL222 (n = 3). (G) Intracellular IL-13 expression, as measured by flow cytometry, in murine CD4+ effector T cells following polarisation towards Th2 in the presence and absence of WWL222 (n = 3). (H) Intracellular IL-17 expression, as measured by flow cytometry, in murine CD4+ effector T cells following polarisation towards Th17 in the presence and absence of WWL222 (n = 3). Experiments were carried out using human samples, unless otherwise stated. CD4+ T cells were activated with α-CD3 and α-CD28 for 24 h, in the presence and absence of ML-226, unless otherwise stated. Data are expressed as mean, with paired dots representing biological replicates.
Figure 2.
Figure 2.. ABHD11 inhibition rewires mitochondrial metabolism in human T cells.
(A) α-ketoglutarate dehydrogenase (α-KGDH) activity in CD4+ effector T cells (n = 8). (B) Oxygen consumption rate (OCR) in CD4+ effector T cells (n = 5). Pre-optimised injections include: oligomycin, FCCP, antimycin A/rotenone (all 1 μM) and monensin (20 μM). (C) Calculated OCR parameters including basal respiration, ATP-linked respiration, spare respiratory capacity and maximal respiratory capacity, from OCR measured in (B). (D) Basal and maximal ATP production (JATP), from OCR measured in (B). (E) Intracellular levels of selected TCA cycle intermediates in CD4+ effector T cells (n = 5). Metabolites include: acetyl-CoA, citrate/isocitrate, α-ketoglutarate (α-KG), succinate and malate. (F) Determination of intracellular α-KG to succinate ratio in CD4+ effector T cells (n = 5). (G) Intracellular levels of selected amino acids in CD4+ effector T cells (n = 5). Metabolites include: glutamate, aspartate and asparagine. (H) Mitochondrial content, as determined by MitoTracker Green, in CD4+ effector T cells (n = 6). (I) Mitochondrial membrane potential, as determined by TMRE staining, in CD4+ effector T cells (n = 6). FCCP (1 μM) was used as a positive control. (J) Extracellular acidification rate (ECAR) in CD4+ effector T cells (n = 5). Pre-optimised injections include: oligomycin, FCCP, antimycin A/rotenone (all 1 μM) and monensin (20 μM). (K) Calculated ECAR parameters including basal glycolysis and maximal glycolysis, from ECAR measured in (J). (L) Basal and maximal ATP production (JATP), from ECAR measured in (J). (M) Intracellular levels of lactate in CD4+ effector T cells (n = 5). (N) Extracellular lactate in cell-free supernatants from cultures of CD4+ effector T cells (n = 15). All experiments were carried out using human samples. CD4+ T cells were activated with α-CD3 and α-CD28 for 24 h, in the presence and absence of ML-226, unless otherwise stated. Data are expressed as either: mean, with paired dots representing biological replicates; or mean ± SEM.
Figure 3.
Figure 3.. ABHD11 inhibition activates SREBP signalling to drive oxysterol synthesis
(A) Differential expression analysis by RNA-Seq in CD4+ effector T cells (n = 4). Blue and red data points represent downregulated and upregulated genes, respectively. Transcripts with an adjusted p-value < 0.05 were considered differentially expressed. (B) Pathway enrichment analysis based on differentially-expressed genes. Top 10 enriched pathways are shown. (C) Transcription factor enrichment analysis based on differentially-expressed genes. The lower the “Average Rank” value, the more enriched the transcription factor activity. Top 10 enriched transcription factors are shown. (D) GSEA enrichment plot for Sterol Biosynthetic Process. (E) Total intracellular sterol levels in CD4+ T cells (n = 5). (F) Intracellular non-oxygenated sterol levels in CD4+ T cells (n = 5). (G) Intracellular oxysterol levels in CD4+ T cells (n = 5). (H) Intracellular levels of selected oxysterols in CD4+ T cells (n = 5). Metabolites include: 4β-hydroxycholesterol, 7α-hydroxycholesterol, 24-hydroxycholesterol, 25-hydroxycholesterol, 27-hydroxycholesterol, 24,25-epoxycholesterol. Heatmap represented as Log2(fold-change) versus vehicle control. (I) Expression of LXR-associated genes in CD4+ T cells (n = 4). Heatmap represented as individual gene Z-scores. (J) IL-2 and IFNγ production by CD4+ T cells, activated in the presence and absence of ML-226 or GW3965 (n = 6). All experiments were carried out using human samples. CD4+ T cells were activated with α-CD3 and α-CD28 for 24 h, in the presence and absence of ML-226, unless otherwise stated. Data are expressed as either: mean, with paired dots representing biological replicates; or mean ± SEM.
Figure 4.
Figure 4.. ABHD11 inhibition impairs CD4+ T cell function in autoimmunity
(A) Experimental design of autoimmune cohort (rheumatoid arthritis [RA] and type 1 diabetes) CD4+ T cells. (B-C) IL-2, IL-10, IL-17, IFNγ and TNFα production by patient-derived CD4+ T cells in autoimmune cohorts of (B) RA (n = 7) and (C) T1D (n = 8). (D-E) Surface expression of activation markers (CD25, CD44 and CD69), as measured by flow cytometry, on patient-derived CD4+ T cells, in autoimmune cohorts of (D) RA (n = 7) and (E) T1D (n = 8). (F) Experimental design of RA patient synovial fluid mononuclear cells (SFMCs). (G) IL-2, IL-10, IL-17, IFNγ and TNFα production by patient-derived SFMCs (n = 5). (H) Surface expression of activation markers (CD25, CD44 and CD69), as measured by flow cytometry, on patient-derived SFMCs (n = 5). All experiments were carried out using human samples. CD4+ T cells were activated with α-CD3 and α-CD28 for 24 h, in the presence and absence of ML-226, unless otherwise stated. Data are expressed as mean ± SEM.
Figure 5.
Figure 5.. ABHD11 inhibition impairs the function of antigen-specific T cells
(A) Frequency of proliferating cells, as measured by flow cytometry using CFDA-SE, on antigen-specific T cells (n = 4). (B) Surface expression of activation markers (CD25 and CD69), as measured by flow cytometry, on antigen-specific T cells (n = 4). (C) IFNγ, IL-2, IL-10, IL-17 and TNFα production by antigen-specific T cells. All experiments were carried out using murine samples. BDC2.5 CD4+ T cells were activated with hybrid insulin peptides (HIPs), in the presence and absence of WWL222. Data are expressed as mean.
Figure 6.
Figure 6.. ABHD11 inhibition delays the onset of type 1 diabetes
(A) Schematic overview of in vivo diabetes adoptive transfer model using BDC2.5 HIP-activated BDC2.5 CD4+ T cells. (B) Diabetes incidence, as confirmed by blood glucose measurement > 13.9 mmol/L, in the presence and absence of daily injections i.p of 2.5 mg/kg WWL222. (C) Surface expression of CD69 as a measure of activation, as measured by flow cytometry, on CD4+ T cells (n = 5). (D) TNFα and IL-2 production, as measured by flow cytometry, by CD4+ T cells (n = 5). All experiments were carried out using murine samples. Mice were injected daily with the indicated dose of WWL222. Data are expressed as median ± interquartile range.

Similar articles

References

    1. Jones N. et al. Akt and STAT5 mediate naive human CD4+T-cell early metabolic response to TCR stimulation. Nature Communications 10 (2019). - PMC - PubMed
    1. Gubser P.M. et al. Rapid effector function of memory CD8+ T cells requires an immediate-early glycolytic switch. Nature Immunology 14, 1064-+ (2013). - PubMed
    1. Wu B., Goronzy J.J. & Weyand C.M. Metabolic Fitness of T Cells in Autoimmune Disease. Immunometabolism 2 (2020). - PMC - PubMed
    1. Yin Y.M. et al. Normalization of CD4+ T cell metabolism reverses lupus. Science Translational Medicine 7 (2015). - PMC - PubMed
    1. Wu B.W. et al. Mitochondrial aspartate regulates TNF biogenesis and autoimmune tissue inflammation. Nature Immunology 22, 1551-+ (2021). - PMC - PubMed

Publication types