. 2025 Jul 11;231(6):e1170-e1182.
doi: 10.1093/infdis/jiaf166.

Transcriptome Analysis of Monocytes Treated With Dengue Virus Nonstructural Protein 1 Revealed a Shift in Transcripts Involved in Self-Propagated Proinflammation and Antiviral Responses

Affiliations

Transcriptome Analysis of Monocytes Treated With Dengue Virus Nonstructural Protein 1 Revealed a Shift in Transcripts Involved in Self-Propagated Proinflammation and Antiviral Responses

Khwankhao Saisingha et al. J Infect Dis. .

Abstract

Nonstructural protein 1 (NS1) of dengue virus (DENV) can influence dengue severity. In this study, we used RNA sequencing analysis to assess the blood monocyte response to different concentrations of NS1. We showed that NS1 at the level found in severe dengue may be involved in severe dengue development through 2 potential mechanisms: induction of excessive inflammation and suppression of antiviral responses. At high levels, NS1 significantly up-regulated S100A8 and S100A9, ACOD1, and TREM1, which might help amplify the inflammatory loops. In terms of antiviral suppression, we found that high NS1 concentration significantly suppressed interferon signaling and major histocompatibililty complex class II transcripts. This potentially delayed the clearance of both DENV and NS1 protein. Our study highlighted the possible role of NS1-activated monocytes in dengue severity.

Keywords: Dengue virus; monocyte; nonstructural protein 1; transcriptome analysis.


Conflict of interest statement

Potential conflicts of interest. All authors: No reported conflicts. All authors have submitted the ICMJE Form for Disclosure of Potential Conflicts of Interest. Conflicts that the editors consider relevant to the content of the manuscript have been disclosed.

Figures

Figure 1.
Figure 1.
Differential cytokine production in primary monocytes treated with high or low level of dengue virus nonstructural protein 1 (NS1). A, Left, Mean fluorescence intensity of NS1 protein from the treated cultures measured at 18 hours after treatment. Data are presented as mean (SEM) (n = 3). *P ≤ .05; **P ≤ .001 (1-tailed Student t test); NS, not significant. A, Right, Representative immunofluorescence assay images of surface NS1 interaction with blood monocytes (scale bars represent 20 μm). Medium-treated monocytes were used as mock control. Abbreviation: DAPI, 4’,6-diamidino-2-phenylindole. B, Secretion of interleukin 6, 10, and 1β (IL-6, IL-10, and IL-1β) from NS1-treated monocytes at 24 hours after treatment, measured with sandwich enzyme-linked immunosorbent assay. Data are presented as mean (SEM) (n = 3). *P ≤ .05; **P ≤ .001 (1-tailed Student t test). Medium-treated and 1 μg/mL lipopolysaccharide (LPS)–treated monocytes were used as mock and positive controls, respectively.
Figure 2.
Figure 2.
Principal component (PC) analysis and clustering analyses of whole transcriptome after treatment of primary monocytes with high or low levels of dengue virus nonstructural protein 1 (NS1). A, PC analysis of NS1-treated monocyte transcriptome at 18 and 24 hours after treatment. B, Hierarchical clustering analysis based on top 10 000 most variable genes at 18 and 24 hours after treatment.
Figure 3.
Figure 3.
Volcano plots of differentially expressed genes (DEGs) identified in primary monocytes treated with high or low level of nonstructural protein 1 (NS1). Dots outside the dashed lines at the centre of each graph represent selected DEGs (false discovery rate–adjusted P ≤ .05; │log2 fold change│ ≥1). Numbers and percentages of the up- or down-regulated DEGs with these criteria are written on the plots. Blue dots inside dashed lines represent genes with adjusted P values ≤.05, but with │log2 fold change│ <1.
Figure 4.
Figure 4.
Biological functions enriched in the up-regulated genes. A, B, Overrepresentative gene ontology (GO) functional enrichment of the different nonstructural protein 1 (NS1)–treated conditions (0.2 or 10 μg/mL NS1 at 18 or 24 hours after treatment). C, Protein-protein interaction networks of the genes that were significantly enriched to a GO term for “inflammatory response” (GO: 0006954). Subsets of genes related to interleukin 10 (IL-10) and Toll-like receptor 4 (TLR4) signaling are outlined. FDR–adjusted P values of the enrichment are shown for each network. Abbreviations: LPS, lipopolysaccharide; Padj, FDR-adjusted P.
Figure 5.
Figure 5.
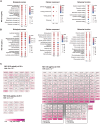
Biological functions enriched in the down-regulated genes identified in 10 μg/mL nonstructural protein 1 (NS1)–treated monocytes. A, Overrepresentative gene ontology functional enrichment of the 10 μg/mL NS1–treated conditions at 18 and 24 hours after treatment. Abbreviations: MHC, major histocompatibililty complex; Padj, FDR-adjusted P; TCR, T-cell receptor. B, Protein-protein interaction networks of genes significantly enriched to “interferon signaling” (HSA-913531). FDR–adjusted P values of the enriched term are shown for each network.
Figure 6.
Figure 6.
Validation of RNA-sequencing gene expression results in nonstructural protein 1 (NS1)–treated monocytes (0.2 or 10 μg/mL NS1 at 18 or 24 hours after treatment). A, B, Bar plots showing comparisons between log2 fold changes of the selected genes measured with RNA-sequencing or reverse-transcription polymerase chain reaction (RT-PCR) of the up-regulated (A) or down-regulated genes (B). β-actin was used as an internal control. Stars represent RNAseq-identified differentially expressed genes (NS1 treated vs mock treated, with absolute log2 fold change ≥1 and false discovery rate–adjusted P value [Wald test] ≤.05). Data are shown as mean (SEM) (n = 3). *P ≤.05; **P ≤.01 (paired 2-tailed Student t test; NS1 treated vs mock treated). C, Left, Histogram of reactive oxygen species (ROS)–positive monocyte cell counts. Data are representative of 3 independent experiments. C, Right, Bar graphs showing mean fluorescence intensity (MFI) for ROS level in blood monocytes by different treatments at 18 hours after treatment. Lipopolysaccharide (LPS) was used as a positive control. Data are shown as mean (SEM) (n = 3). *P ≤ .05; **P ≤ .01 (2-tailed Student t test). Abbreviations: FITC, fluorescein isothiocyanate; NS, not significant.
Figure 7.
Figure 7.
Hypothetical diagram of the transcriptomic responses in monocytes treated with high level of nonstructural protein 1 (NS1). Binding of dengue virus (DENV) NS1 to Toll-like receptor 4 (TLR4) potentially activates downstream transcription factors, including NF-κB, cAMP response element-binding protein (CREB), and Activator protein 1 (AP1). These up-regulate several proinflammatory mediators, including IL-10, S100A8 and S100A9, triggering receptor expressed on myeloid cell 1 (TREM-1), and aconitate decarboxylase 1 (ACOD1). Secreted S100A8/A9 heterodimer recruit leukocytes to the site and can itself be recognized by TLR4. Stimulated TREM-1 induces NF-κB activation, as well as amplifying TLR4 responses. ACOD1 functions within mitochondria to modulate reactive oxygen species (ROS) production, which in turn induces NF-κB activation. On the other hand, some down-regulated processes may hamper viral and NS1 elimination. Expression of interferon (IFN)–responsive genes, including type I IFN, IRF3, and several IFN-stimulated genes (ISGs) are down-regulated. CIITA transcription regulator along with its HLA-D transcripts are heavily down-regulated as well. These down-regulated events may be partially explained by the observed up-regulation of IL10. Interleukin 10 (IL-10)/ Signal transducer and activator of transcription 3 (STAT3)/suppressors of cytokine signaling system (SOCS) may further hamper the IFN signaling [23]. Solid boxes indicate up-regulated differentially expressed genes (DEGs); dashed boxes, down-regulated DEGs. Abbreviations: CEBPB, CCAAT enhancer binding protein beta; FOS, Fos proto-oncogene/AP1 transcription factor subunit; IFNAR, interferon alpha/beta receptor; IFNGR, interferon gamma receptor; IL-1, interleukin 1; IL-6, interleukin 6; IRAKs, interleukin 1 receptor associated kinase; IRF3, interferon regulatory factor 3; MAPKs, mitogen-activated protein kinases; MyD88, myeloid differentiation primary response 88.

References

    1. Saxena SK, Kumar S, Maurya VK. The global distribution and burden of dengue and Japanese encephalitis co-infection in acute encephalitis syndrome. In: Rodriguez-Morales AJ, eds. Current topics in neglected tropical diseases. Rijeka, Croatia: IntechOpen, 2019:1–10.
    1. Guzman MG, Harris E. Dengue. Lancet 2015; 385:453–65. - PubMed
    1. Srikiatkhachorn A. Plasma leakage in dengue hemorrhagic fever. Thromb Haemost 2009; 102:1042–9. - PMC - PubMed
    1. Suwarto S, Sasmono RT, Sinto R, Ibrahim E, Suryamin M. Association of endothelial glycocalyx and tight and adherens junctions with severity of plasma leakage in dengue infection. J Infect Dis 2017; 215:992–9. - PMC - PubMed
    1. Pan P, Li G, Shen M, et al. DENV NS1 and MMP-9 cooperate to induce vascular leakage by altering endothelial cell adhesion and tight junction. PloS Pathog 2021; 17:e1008603. - PMC - PubMed

Substances