. 2025 Apr 1;135(7):e181928.
doi: 10.1172/JCI181928.

Endothelial MICU1 protects against vascular inflammation and atherosclerosis by inhibiting mitochondrial calcium uptake

Affiliations

Endothelial MICU1 protects against vascular inflammation and atherosclerosis by inhibiting mitochondrial calcium uptake

Lu Sun et al. J Clin Invest. .

Abstract

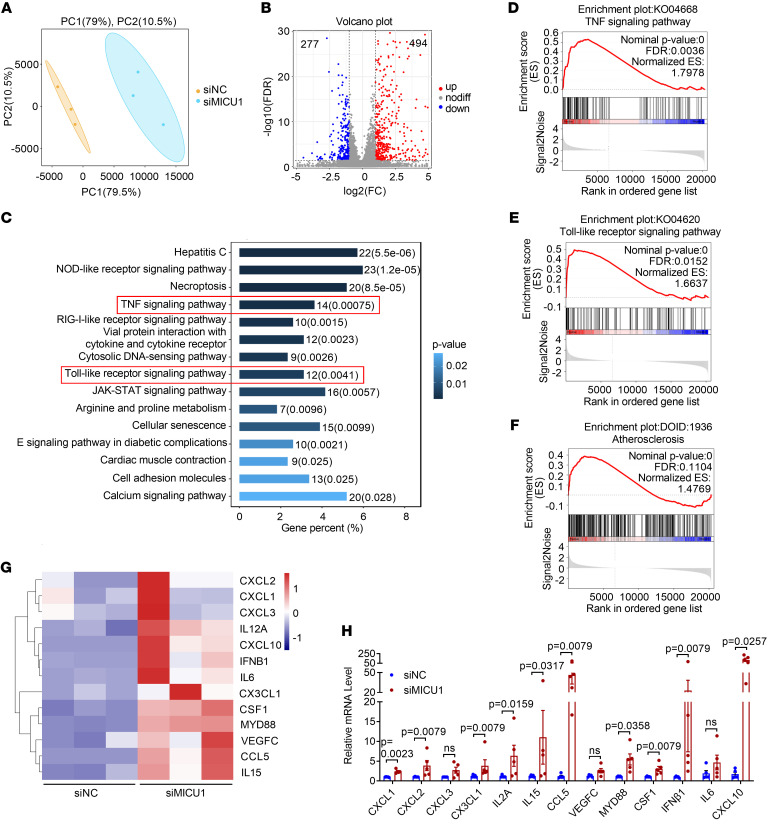
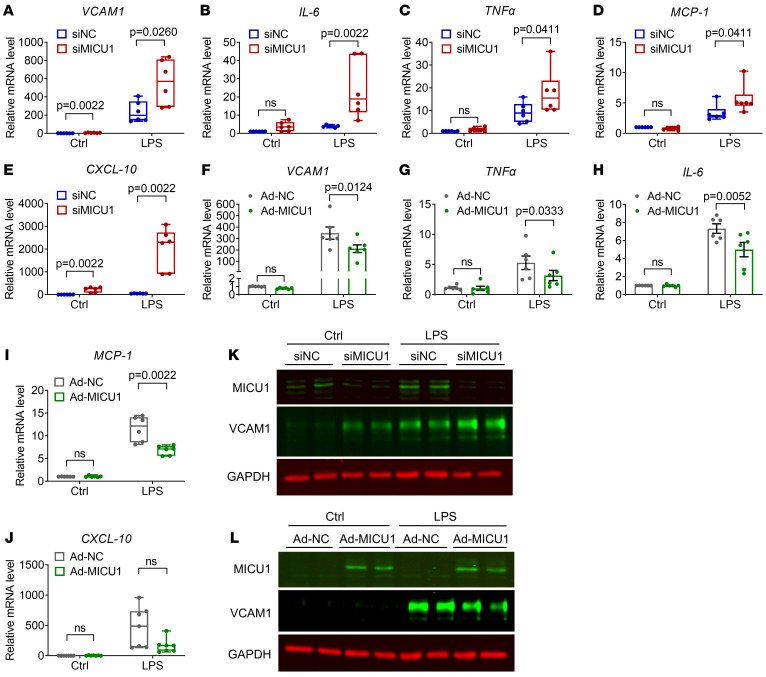
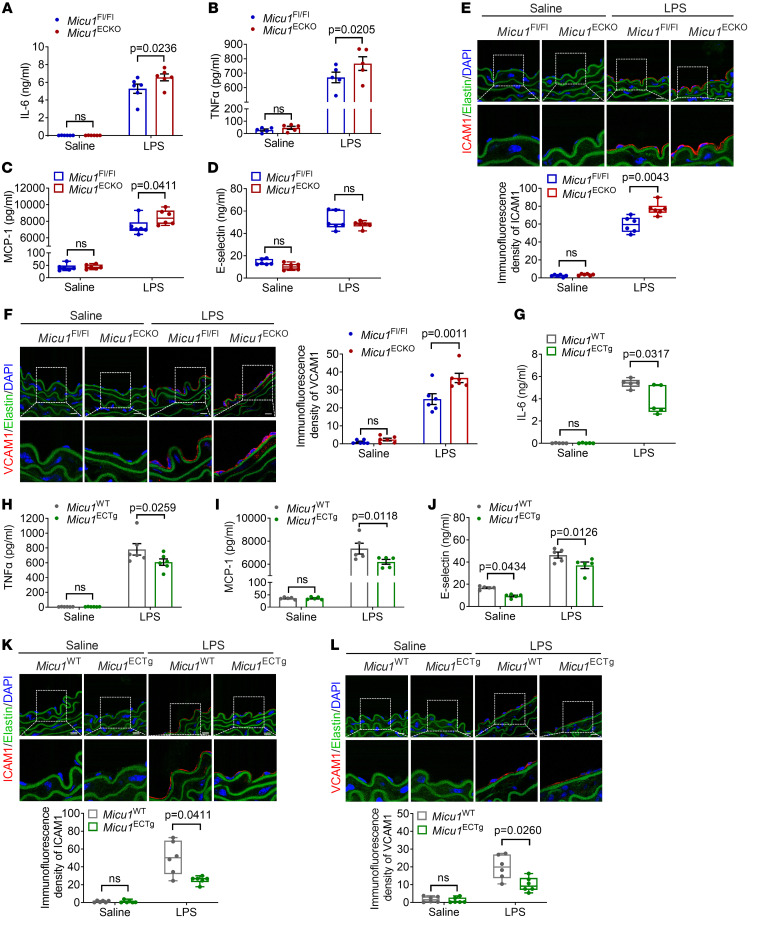
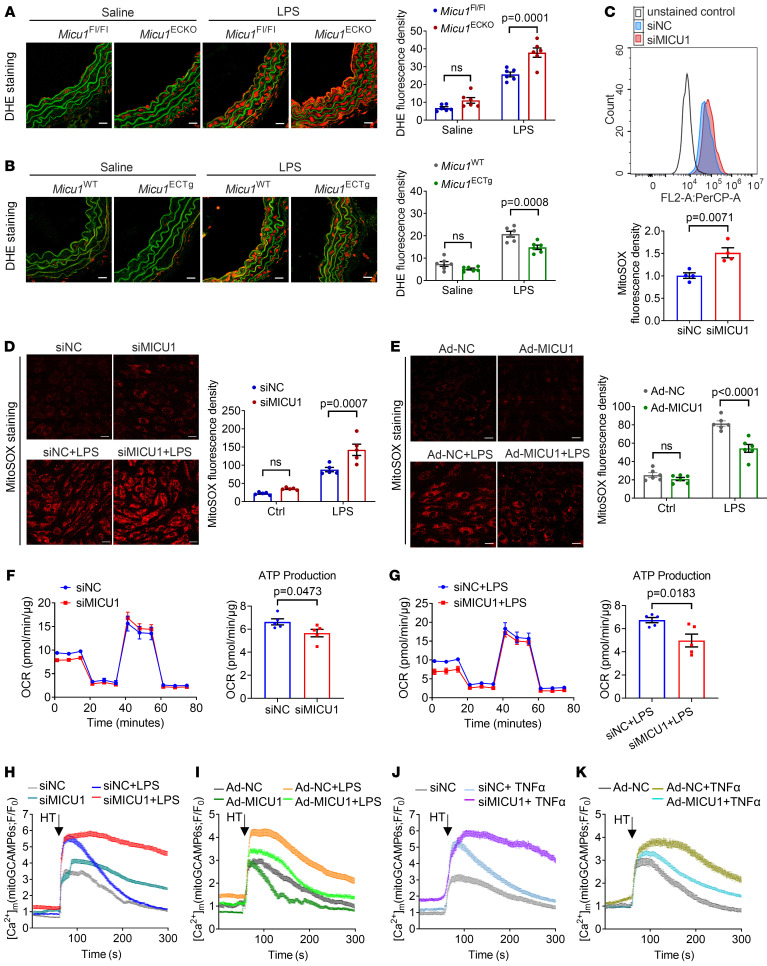
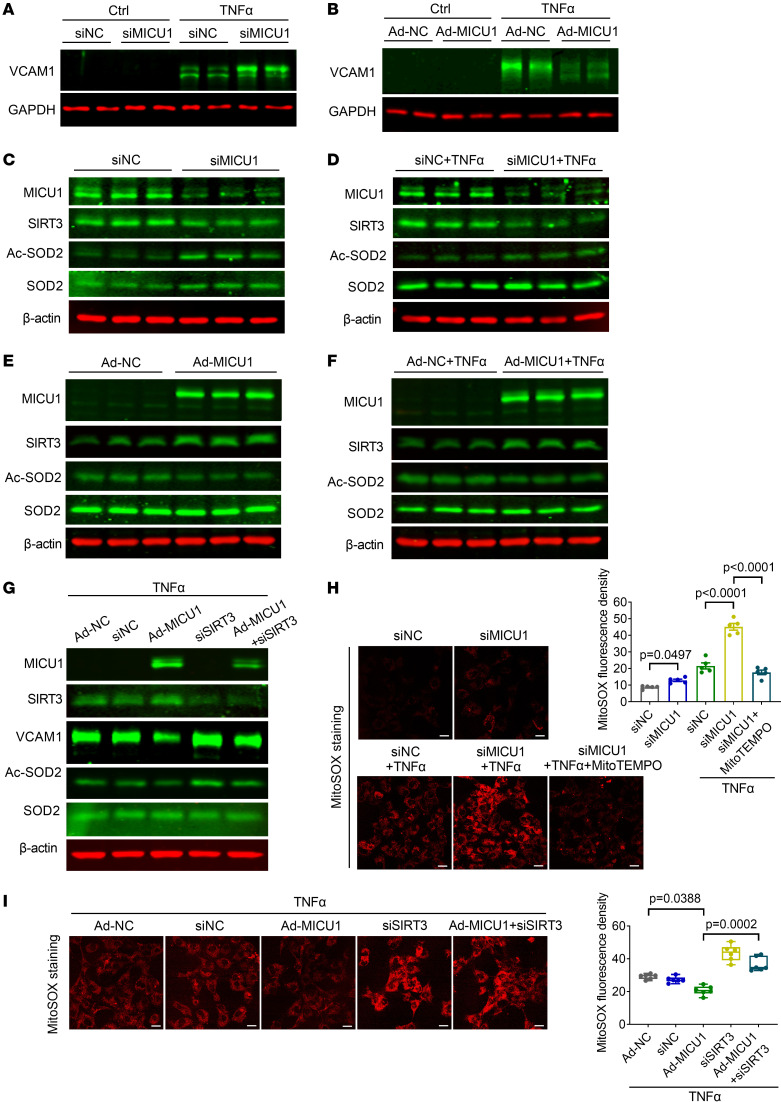
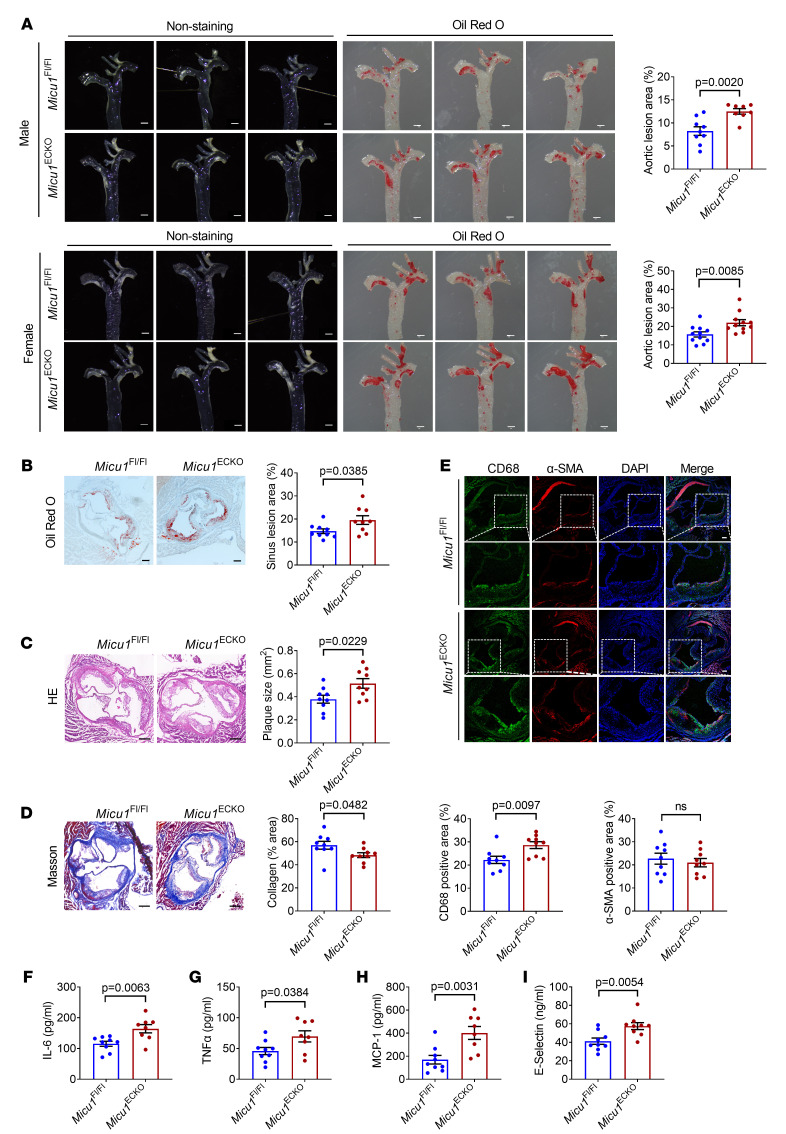
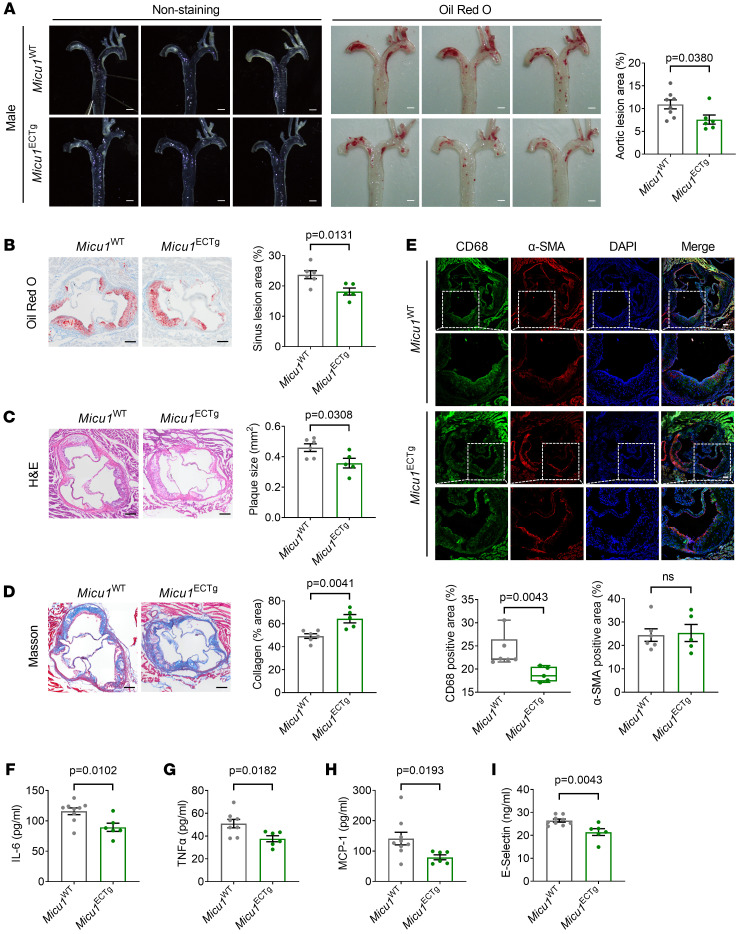
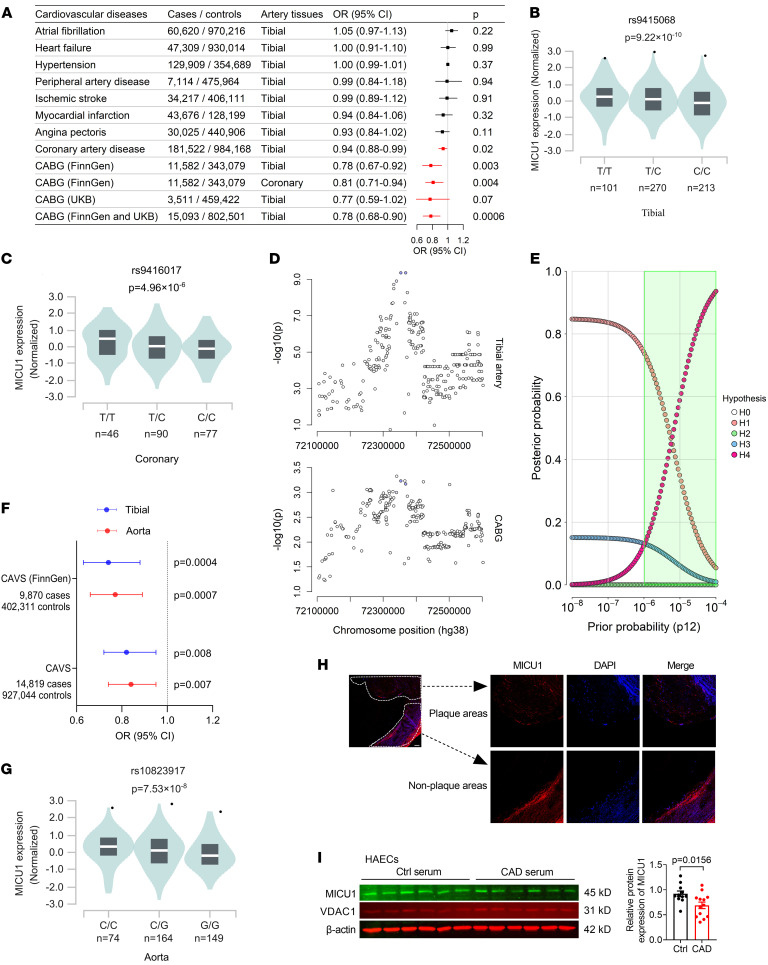
Mitochondrial dysfunction fuels vascular inflammation and atherosclerosis. Mitochondrial calcium uptake 1 (MICU1) maintains mitochondrial Ca2+ homeostasis. However, the role of MICU1 in vascular inflammation and atherosclerosis remains unknown. Here, we report that endothelial MICU1 prevents vascular inflammation and atherosclerosis by maintaining mitochondrial homeostasis. We observed that vascular inflammation was aggravated in endothelial cell-specific Micu1 knockout mice (Micu1ECKO) and attenuated in endothelial cell-specific Micu1 transgenic mice (Micu1ECTg). Furthermore, hypercholesterolemic Micu1ECKO mice also showed accelerated development of atherosclerosis, while Micu1ECTg mice were protected against atherosclerosis. Mechanistically, MICU1 depletion increased mitochondrial Ca2+ influx, thereby decreasing the expression of the mitochondrial deacetylase sirtuin 3 (SIRT3) and the ensuing deacetylation of superoxide dismutase 2 (SOD2), leading to the burst of mitochondrial reactive oxygen species (mROS). Of clinical relevance, we observed decreased MICU1 expression in the endothelial layer covering human atherosclerotic plaques and in human aortic endothelial cells exposed to serum from patients with coronary artery diseases (CAD). Two-sample Wald ratio Mendelian randomization further revealed that increased expression of MICU1 was associated with decreased risk of CAD and coronary artery bypass grafting (CABG). Our findings support MICU1 as an endogenous endothelial resilience factor that protects against vascular inflammation and atherosclerosis by maintaining mitochondrial Ca2+ homeostasis.

Keywords: Atherosclerosis; Cell biology; Vascular biology.


Figures

Figure 1
Figure 1. RNA-Seq profiling reveals the anti-inflammatory role of MICU1 in ECs.
(A) Principal component analysis (PCA) comparing the transcriptomic data and plotting by coordinates for principal component 1 (PC1) and PC2. Color coding was used to separate treatment with negative control siRNA (siNC) or MICU1 siRNA (siMICU1). (B) Volcano plot showing differentially expressed genes after knockdown of MICU1 in HUVECs. Selection criteria: gene expression fold change (FC) ≥ 2 and FDR < 0.05. (C) KEGG enrichment for differentially expressed genes after MICU1 depletion. (DF) GSEA analysis was used to examine the enrichment of the TNF-signaling pathway (D),the TLR-signaling pathway (E), and atherosclerosis (F). (G) Heatmap showing the key differentially expressed genes from the KEGG top pathway related to inflammatory chemokines or cytokines. (H) qRT-PCR analysis of mRNA levels of inflammatory chemokines and cytokines after MICU1 depletion (n = 5). Statistical analysis was performed by Welch’s t test (CXCL1, CXCL3, VEGFC, MYD88, and CXCL10 of H) and Mann-Whitney U test (CXCL2, CX3CL1, IL2A, IL15, CCL5, CSF1, IFNβ1, and IL-6 of H).
Figure 2
Figure 2. MICU1 attenuates EC inflammation in vitro.
(AE) qRT-PCR analysis of mRNA levels of VCAM1 (A, n = 6), IL-6 (B, n = 6), TNF-α (C, n = 6), MCP-1 (D, n = 6), and CXCL-10 (E, n = 6) in HUVECs after treatment with siNC or siMICU1 in the presence of LPS (1 μg/ml) for 6 hours. (FJ) HUVECs were transfected with negative control adenovirus (Ad-NC) or MICU1 adenovirus (Ad-MICU1) before qRT-PCR analysis of mRNA levels of VCAM1 (F, n = 6), TNF-α (G, n = 6), IL-6 (H, n = 6), MCP-1 (I, n = 6), and CXCL-10 (J, n = 7). Cells were exposed to LPS (1 μg/ml) for 6 hours. (K) The expression of VCAM1 was detected by immunoblot in HAECs. Cells were treated with siNC or siMICU1 and then exposed to LPS (1 μg/ml) for 6 hours (n = 4). Data shown are from 2 different donors. (L) The expression of VCAM1 was detected by immunoblot in HAECs. Cells were treated with Ad-NC or Ad-MICU1 and then exposed to LPS (1 μg/ml) for 6 hours (n = 4). Data shown are from 2 different donors. Statistical analysis was performed by multiple Mann-Whitney U tests (AE, I, and J) and 2-way ANOVA followed by Bonferroni’s post hoc tests (FH).
Figure 3
Figure 3. MICU1 attenuates EC inflammation in vivo.
(AD) ELISA of IL-6 (A, n = 6), TNF-α (B, n = 5), MCP-1 (C, n = 6), and E-selectin (D, n = 6) in serum from Micu1fl/fl mice or Micu1ECKO mice treated with saline or LPS (10 mg/kg) for 6 hours. (E and F) Representative confocal microscopy images of ICAM1 expression (E, n = 6) and VCAM1 expression (F, n = 6) in the aortic sections of Micu1fl/fl mice or Micu1ECKO mice exposed to saline or LPS (10 mg/kg) for 6 hours. ICAM1 or VCAM1 (red), elastin (green), and DAPI (blue). Scale bars: 10 μm. (GJ) ELISA of IL-6 (G, n = 5), TNF-α (H, n = 6), MCP-1 (I, n = 5), and E-selectin (J, n = 5) in serum from Micu1WT mice or Micu1ECTg mice exposed to saline or LPS (10 mg/kg) for 6 hours. (K and L) Representative images of ICAM1 (K, n = 6) and VCAM1 protein expression (L, n = 6) in the aortic sections of Micu1WT mice or Micu1ECTg mice exposed to saline or LPS (10 mg/kg) for 6 hours. Scale bars: 10 μm. Original magnification, ×80. Statistical analysis was performed by 2-way ANOVA followed by Bonferroni’s post hoc tests (A, B, F, and HJ) and multiple Mann-Whitney U tests (CE, G, K, L).
Figure 4
Figure 4. MICU1 regulates mitochondrial Ca2+ uptake and ROS production in ECs.
(A and B) Dihydroethidium (DHE) staining of aortic sections from Micu1fl/fl mice or Micu1ECKO mice (A), Micu1WT mice or Micu1ECTg mice (B) treated with saline or LPS (10 mg/kg) for 6 hours (n = 6). Scale bars: 20 μm. (C) Flow cytometry analysis of mROS levels using MitoSOX (n = 4). (D and E) MitoSOX fluorescence in HAECs depleted of MICU1 (D, n = 5) or overexpressed MICU1 (E, n = 6). Scale bars: 20 μm. (F) OCR of HAECs transfected with siNC or siMICU1. ATP production-linked OCR was analyzed and quantified. (G) OCR of HAECs transfected with siNC or siMICU1 in the presence of LPS (1μg/ml, 16 hours). ATP production-linked OCR was analyzed and quantified. (H) Kinetics of [Ca2+]m in response to HT (50 μM) in HAECs treated with siNC or siMICU1 in the presence (siNC+LPS, n = 30 cells; siMICU1+LPS, n = 10 cells) or absence (siNC, n = 15 cells; siMICU1, n = 10 cells) of LPS (1μg/ml) for 6 hours. (I) Kinetics of [Ca2+]m in response to HT (50 μM) in HAECs treated with Ad-NC or Ad-MICU1 in the presence (Ad-NC+LPS, n = 11 cells; Ad-MICU1+LPS, n = 15 cells) or absence (Ad-NC, n = 8 cells; Ad-MICU1, n = 13 cells) of LPS (1μg/ml) for 6 hours. (J and K) Kinetics of [Ca2+]m in response to HT (50 μM) in HAECs treated with siNC or siMICU1 (J), Ad-NC, or Ad-MICU1 (K) in the presence or absence of TNF-α (10 ng/ml) for 6 hours (siNC, n = 10 cells; siNC+TNF-α, n = 14 cells; siMICU1+TNF-α, n = 20 cells; Ad-NC, n = 13 cells; Ad-NC +TNF-α, n = 16 cells; Ad-MICU1+TNF-α, n = 27 cells). Statistical analysis was performed by 2-way ANOVA followed by Bonferroni’s post hoc tests (A, B, D, and E) and Student’s t test (C, F, and G).
Figure 5
Figure 5. MICU1 regulates EC inflammation via [Ca2+]m and SIRT3/SOD2 pathway.
(A) Protein expression of VCAM1 was determined by immunoblot in HAECs. Cells were treated with siNC or siMICU1 and then exposed to TNF-α (10 ng/ml) for 6 hours (n = 6). (B) Protein expression of VCAM1 was determined by immunoblot in HAECs. Cells were treated with Ad-NC or Ad-MICU1 and then exposed to TNF-α (10 ng/ml) for 6 hours (n = 6). (C and D) Protein expression of SIRT3 and Ac-SOD2 were determined by immunoblot after MICU1 silencing in HAECs in the presence or absence of TNF-α (10 ng/ml) for 6 hours (n = 6). (E and F) Protein expression of SIRT3 and Ac-SOD2 were determined by immunoblot after MICU1 overexpression in HAECs in the presence or absence of TNF-α (10 ng/ml) for 6 hours (n = 6). (G) Protein expression of SIRT3, Ac-SOD2, and VCAM1 in HAECs was determined by immunoblot with SIRT3 silencing and MICU1 overexpression concurrently. Cells were exposed to TNF-α (10 ng/ml) for 6 hours (n = 5). (H) Representative images showing MitoSOX fluorescence in HAECs transfected with siNC or siMICU1 and then exposed to TNF-α (10 ng/ml). MitoTEMPO (5 μM) was added for 1 hour (n = 5). (I) Representative images showing MitoSOX fluorescence in HAECs with SIRT3 silencing or MICU1 overexpression or SIRT3 silencing and MICU1 overexpression concurrently and then exposed to TNF-α (10 ng/ml) (n = 6). Scale bars: 20 μm. Statistical analysis was performed by 1-way ANOVA followed by Bonferroni’s post hoc tests (H) and Kruskal-Wallis test followed by Dunn’s multiple-comparisons test (I).
Figure 6
Figure 6. MICU1 deletion in ECs aggravates atherosclerosis.
(A) Representative images of Oil Red O staining of atherosclerotic lesions of aorta in male (n = 8–9) and female (n = 11) Micu1fl/fl mice or Micu1ECKO mice infected with AAV8-PCSK9D377Y after 12 weeks of Western diet feeding. Scale bars: 1 mm. (BD) Oil Red O staining (B), H&E staining (C), or Masson staining (D) of lesions of the aortic root in male Micu1fl/fl mice or Micu1ECKO mice from A (n = 9). Scale bars: 200 μm. (E) Staining of CD68-positive macrophages in lesion area of the aortic sinus from male Micu1fl/fl mice or Micu1ECKO mice from A (n = 9). Scale bars: 100 μm. Original magnification, ×20. (FI) ELISA of serum IL-6 (F), serum TNF-α (G), serum MCP-1 (H), and serum E-selectin (I) from male Micu1fl/fl mice or Micu1ECKO mice infected with AAV8-PCSK9D377Y after 12 weeks of Western diet feeding (n = 8–9). Statistical analysis was performed by Student’s t test (AI).
Figure 7
Figure 7. MICU1 overexpression in ECs attenuates atherosclerosis.
(A) Representative images of Oil Red O staining of atherosclerotic lesions of aorta in male Micu1WT mice or Micu1ECTg mice infected with AAV8-PCSK9D377Y after 12 weeks of Western diet (n = 6–8). Scale bars: 1 mm. (BD) Oil Red O staining (B), H&E staining (C), or Masson staining (D) of lesions of the aortic root in male Micu1WT mice or Micu1ECTg mice from A (n = 5–6). Scale bars: 200 μm. (E) Staining of CD68-positive macrophages in lesion area of the aortic sinus from male Micu1WT mice or Micu1ECTg mice from A (n = 5–6). Scale bars: 100 μm. Original magnification, ×20. (FI) ELISA of serum IL-6 (F), serum TNF-α (G), serum MCP-1 (H), and serum E-selectin (I) from male Micu1WT mice or Micu1ECTg mice infected with AAV8-PCSK9D377Y after 12 weeks of Western diet (n = 6–9). Statistical analysis was performed by Student’s t test (AD, α-SMA of E, F, G, and I), Mann-Whitney U test (CD68 of E), and Welch’s t test (H).
Figure 8
Figure 8. Clinical relevance of MICU1 expression to cardiovascular diseases in patients.
(A) Two-sample Wald ratio MR testing effects of MICU1 expression in vascular artery tissues on cardiovascular diseases. (B) eQTL analysis from GTEx revealed that the risk allele (C) associated with CABG is correlated with decreased MICU1 expression in tibial artery tissue for a lead eQTL (rs9415068). (C) eQTL analysis from GTEx revealed that the risk allele (C) associated with CABG is correlated with decreased MICU1 expression in coronary artery tissue for a lead eQTL (rs9416017). (D) Regional association plots highlighting ± 250 kb surrounding the lead eQTL (rs9415068) in MICU1 locus for tibial artery (top) and CABG on chromosome 10. (E) Results from a Bayesian colocalization sensitivity analysis are presented. From the default (P12 = 1 × 10⁻⁵) to more optimistic (P12 = 1 × 10⁻⁴) priors, there is intermediate (59.3%) to strong (93.6%) posterior probability for a shared causal variant at the MICU1 locus. The shaded green region denotes the range of prior probabilities, which results in probability of H4 (shared causal variant) > H3 (distinct causal variants). (F) Two-sample Wald ratio of MR testing effects of MICU1 expression in vascular artery tissues on CAVS. (G) eQTL analysis revealed that the risk allele (G) associated with CAVS is correlated with decreased MICU1 expression in aorta artery tissue for a lead eQTL (rs10823917). (H) Representative immunofluorescence is shown for the expression of MICU1 in human aortas with atherosclerosis. Confocal microscopy images showed MICU1 (red) and DAPI (blue). Scale bars: 100 μm (n = 4). (I) The expression of MICU1 in HAEC treatment with human serum of CAD compared with healthy condition for 24 hours (controls, n = 11; CAD, n = 13). Statistical analysis was performed by Student’s t test.

Similar articles

Cited by

References

    1. Bjorkegren JLM, Lusis AJ. Atherosclerosis: recent developments. Cell. 2022;185(10):1630–1645. - PMC - PubMed
    1. Opstal TSJ, et al. Colchicine attenuates inflammation beyond the inflammasome in chronic coronary artery disease: a LoDoCo2 proteomic substudy. Circulation. 2020;142(20):1996–1998. doi: 10.1161/CIRCULATIONAHA.120.050560. - DOI - PubMed
    1. Ridker PM. Targeting residual inflammatory risk: The next frontier for atherosclerosis treatment and prevention. Vascul Pharmacol. 2023;153:107238. doi: 10.1016/j.vph.2023.107238. - DOI - PubMed
    1. Ridker PM, et al. Inflammation and atherosclerosis. Circulation. 2023;105(9):1135–1143. - PubMed
    1. Xu S, et al. Endothelial dysfunction in atherosclerotic cardiovascular diseases and beyond: from mechanism to pharmacotherapies. Pharmacol Rev. 2021;73(3):924–967. doi: 10.1124/pharmrev.120.000096. - DOI - PubMed

MeSH terms