. 2025 May;603(9):2741-2762.
doi: 10.1113/JP286689. Epub 2025 Apr 1.

The effects of local vibration inducing a tonic vibration reflex or movement illusion on acute modulations of corticospinal excitability

Affiliations

The effects of local vibration inducing a tonic vibration reflex or movement illusion on acute modulations of corticospinal excitability

Nicolas Amiez et al. J Physiol. 2025 May.

Abstract

Stimulation of muscle afferents by local vibration (LV) can lead to two distinct perceptual and motor responses: the tonic vibration reflex (TVR) or the movement illusion. This study aimed to evaluate the effect of TVR and movement illusion on corticospinal excitability. In two experiments, EMG activity of the vibrated flexor carpi radialis (FCR) muscle (80 Hz, 6 min) and the extensor carpi radialis (ECR) muscle were recorded. Illusion was assessed using questionnaires. LV conditions were adjusted to favour either TVR (visual attention focused on the vibrating wrist) or ILLUSION (hidden hand, visual attention focused on the EMG of the FCR muscle). Motor-evoked potential (MEP) and cervicomedullary motor-evoked potential (CMEP) were recorded at rest for both muscles before (10 and 0 min) and after (0 and 30 min) each LV condition. Only the TVR condition increased EMG of the FCR muscle (+490% compared to resting, P = 0.005), while movement illusion was greater in the ILLUSION condition (P < 0.001). Concerning the vibrated muscle at P0, TVR reduced the amplitude of CMEP (-13.8 ± 15.8%, P = 0.011) without altering MEP (0.3 ± 27.9%, P = 1), whereas the opposite occurred with movement illusion (i.e. CMEP: -4.5 ± 13.7%, P = 0.891; MEP: -25.1 ± 17.2%, P = 0.002). Cortical excitability (MEP/CMEP ratio) of the vibrated muscle was reduced by 24 ± 13.3% on average compared to values obtained before LV, only in the ILLUSION condition. In conclusion, this study highlights the relevance of measuring and reporting the perceptual and motor responses induced during LV, demonstrating that TVR and movement illusion partly determine the acute effects on the neural network. KEY POINTS: Tonic vibration reflex and movement illusion are rarely controlled and measured in studies investigating the effect of LV on corticospinal excitability. The application of LV with visual attention focused on the vibrated muscle promotes the presence of a tonic vibration reflex (TVR). The absence of visual feedback on the latter promotes the presence of an illusion of movement. The cortical excitability of the vibrated muscle is influenced differently according to the perceptual and motor responses induced during LV, with an opposite effect on the cortical excitability of the antagonist muscle. Improved control of LV application conditions, quantification of perceptual and motor responses, and reporting of results (e.g. EMG activity of the vibrated muscle or illusion of movement during the protocol) are required to enhance our understanding of the physiological mechanisms associated with LV use and, consequently, the effectiveness of LV as a therapeutic modality.

Keywords: alpha motoneuron excitability; corticospinal excitability; local vibration; movement illusion; tonic vibration reflex.


Conflict of interest statement

The authors have no competing interests or conflicts of interest related to this work.

Figures

Figure 1
Figure 1. Schematic representation of the experimental protocol used and the measurements performed
A, experimental study design involving 15 participants. Cervicomedullary motor‐evoked potential (CMEP) was not measured in two participants because of the discomfort caused by stimulation. The two experiments were spaced at least 48 h apart and differed only in the LV condition (TVR or ILLUSION). Measurements were performed at the start of the protocol (PR1), after 6 min of rest (PR2), and then 0 (P0) and 30 min (P30) after stopping the LV protocol, always using the same order of stimulation techniques: motor‐evoked potential (MEP), followed by CMEP and maximal muscular responses (M MAX). EMG activity of the flexor carpi radialis (FCR) and extensor carpi radialis (ECR) muscle were recorded at rest (6 min) and during LV (6 min). The presence of illusion during LV was assessed using three visual analog scales (VAS) administered 1, 3 and 5 min after the start of the vibratory protocol. B, presentation of the stimulation sites for MEP (transcranial magnetic stimulation, TMS) and CMEP (cervicomedullary stimulation, CMS) of both muscles, and M MAX (percutaneous nerve stimulation, PNS) of the flexor carpi radialis muscle (FCR). C, typical MEP, CMEP and M MAX recorded on the FCR muscle (upper side) and ECR (lower side) of a participant before the LV protocol (i.e. PR2). Black line represents the average, and the grey lines represent each stimulation (i.e. MEP = 15 stimulations, CMEP = 8 stimulations, M MAX = 3 stimulations). Arrows indicate the stimulation artefact. Note that the EMG amplitude scale varies depending on the muscle and the variable represented.
Figure 2
Figure 2. Experimental setup and muscle activity recordings from the vibrated muscle and its antagonist during the local vibration protocol for tonic vibration reflex and movement illusion conditions
A, experimental setup for the TVR condition (no EMG feedback of the vibrated muscle and visual attention focused on the vibrated wrist) and typical rectified EMG activity recorded on the flexor carpi radialis (FCR, black) and extensor carpi radialis (ECR, grey) muscles at the start of the LV protocol. B, experimental setup for the ILLUSION condition (visual attention focused on EMG activity of the FCR muscle and hand hidden by home‐made system). C, example of data obtained for fast Fourier transform (left side) and the rectified EMG activity of the FCR muscle (right side) over 1 s of recording in the TVR condition. D, same data obtained during the ILLUSION condition. Unfiltered signals are shown in black, filtered signals in grey. Note that the amplitude scale of the rectified EMG signal is not the same for FCR and ECR muscles.
Figure 3
Figure 3. Perceptual and motor responses assessed during the vibration protocol under tonic vibration reflex and movement illusion conditions
A, mean of responses obtained on the three VAS at the first, third and fifth minute of the LV protocol for the TVR condition (red) and the ILLUSION condition (grey). For the Student's paired t test: ### P < 0.001. B and C, EMG activity was assessed in the flexor carpi radialis (FCR) muscle (B) and extensor carpi radialis (ECR) muscle (C) both at rest (RMSREST/M MAX; closed symbols) and during the 6 min application of local vibration (RMSLV/M MAX; open symbols) under the TVR (red triangle) and ILLUSION (grey circle) conditions. In B, a participant has a data value outside the scale. Its individual value is indicated by a dotted line, and the precise value is displayed next to the corresponding mark. Repeated measures ANOVA revealed a significant Condition × Time interaction. Difference between conditions: ## P < 0.01; difference within a condition: ** P < 0.01. [Colour figure can be viewed at wileyonlinelibrary.com]
Figure 4
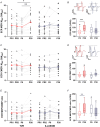
Figure 4. Changes in MEP, CMEP and the MEP/CMEP ratio for the vibrated FCR muscle in the tonic vibration reflex (red) and movement illusion (grey) conditions
A, representation of mean and individual motor‐evoked potential (MEP) recorded on the flexor carpi radialis muscle (FCR, 15 participants) and expressed as a percentage of the maximal M‐wave amplitude (%M MAX). A 6 min LV protocol was performed in the TVR (red triangle) and ILLUSION (grey circle) conditions and measurements were taken 10 and 0 min before (PR1 and PR2, respectively) LV as well as 0 and 30 min (P0 and P30, respectively) after. B, the top panel shows typical MEP data obtained on FCR muscle at PR2 (black, also visible in Fig. 1 for the ILLUSION condition), P0 (light colour) and P30 (dark colour) for both conditions. The lower panel shows the MEP variable at P0 and P30, expressed relative to PR2 (box: 25th to 75th percentile range, whiskers: minimum and maximum values, cross: mean, line: median). C and D, data for cervicomedullary motor‐evoked potential (CMEP) recorded on the FCR muscle (13 participants). E and F, data for MEP/CMEP ratios of the FCR muscle (13 participants). Note that the amplitude scales of typical data are different depending on the condition and measurements. In the presence of a significant Condition × Time interaction to the repeated measures ANOVA, significant difference within a same condition: *, significant difference between the two conditions: #. */# P < 0.05; ** P < 0.01; ***/### P < 0.001. In the presence of a significant Condition effect, $ indicates a significant difference between the two conditions. $$$ P < 0.001. In the presence of a significant Time effect, § indicates a significant difference between P0 and P30, irrespective of the LV protocol used. § P < 0.05. [Colour figure can be viewed at wileyonlinelibrary.com]
Figure 5
Figure 5. Changes in MEP, CMEP and the MEP/CMEP ratio for the antagonist ECR muscle in the tonic vibration reflex (red) and movement illusion (grey) conditions
A, representation of mean and individual motor‐evoked potential (MEP) recorded on the extensor carpi radialis muscle (ECR, 15 participants) and expressed as a percentage of the maximal M‐wave amplitude (%M MAX). A 6 min LV protocol was performed in the TVR (red triangle) and ILLUSION (grey circle) conditions and measurements were taken 10 and 0 min before (PR1 and PR2, respectively) LV as well as 0 and 30 min (P0 and P30, respectively) after. B, the top panel shows typical MEP data obtained on ECR muscle at PR2 (black, also visible in Fig. 1 for the ILLUSION condition), P0 (light colour) and P30 (dark colour) for both conditions. The lower panel shows the MEP variable at P0 and P30, expressed relative to PR2 (box: 25th to 75th percentile range, whiskers: minimum and maximum values, cross: mean, line: median). C and D, data for cervicomedullary motor‐evoked potential (CMEP) recorded on the ECR muscle (13 participants). E and F, data for MEP/CMEP ratios of the ECR muscle (13 participants). Note that the amplitude scales of typical data are different depending on the condition and measurements. In the presence of a significant Condition × Time interaction to the repeated measures ANOVA, significant difference within a same condition: *, significant difference between the two conditions: #. */# P < 0.05; ** P < 0.01; *** P < 0.001. In the presence of a significant Time effect to the repeated measures ANOVA, § indicates a significant difference between P0 and P30, irrespective of the LV protocol used. § P < 0.05. [Colour figure can be viewed at wileyonlinelibrary.com]
Figure 6
Figure 6. Repeated‐measures correlations (rmcorr) between the MEP/CMEP ratio at P0 expressed relative to PR2 for the flexor carpi radialis muscle and the extensor carpi radialis muscle, independently of the vibration condition performed
Two similar colour dots represent each participant's data from each condition (i.e. TVR and ILLUSION), and coloured lines show rmcorr fits for each participant. The result shown on the graph was obtained by conducting statistical analysis on the log‐transformed data. [Colour figure can be viewed at wileyonlinelibrary.com]

Similar articles

References

    1. Abbruzzese, M. , Minatel, C. , Reni, L. , & Favale, E. (2001). Postvibration depression of the H-reflex as a result of a dual mechanism: An experimental study in humans. Journal of Clinical Neurophysiology, 18, 460–470. - PubMed
    1. Aimonetti, J. , & Nielsen, J. B. (2001). Changes in intracortical excitability induced by stimulation of wrist afferents in man. The Journal of Physiology, 534(3), 891–902. - PMC - PubMed
    1. Amiez, N. , Martin, A. , Gaveau, J. , Julliand, S. , Papaxanthis, C. , & Paizis, C. (2024). Local vibration induces changes in spinal and corticospinal excitability in vibrated and antagonist muscles. Journal of Neurophysiology, 131(2), 379–393. - PubMed
    1. Avvantaggiato, C. , Casale, R. , Cinone, N. , Facciorusso, S. , Turitto, A. , Stuppiello, L. , Picelli, A. , Ranieri, M. , Intiso, D. , Fiore, P. , Ciritella, C. , & Santamato, A. (2021). Localized muscle vibration in the treatment of motor impairment and spasticity in post‐stroke patients: A systematic review. European Journal of Physical and Rehabilitation Medicine, 57(1), 44–60. - PubMed
    1. Bakdash, J. Z. , & Marusich, L. R. (2017). Repeated measures correlation. Frontiers in Psychology, 8, 1–13. - PMC - PubMed

LinkOut - more resources