. 2025 Apr 1;135(11):e184036.
doi: 10.1172/JCI184036. eCollection 2025 Jun 2.

Cxcr3 promotes protection from colorectal cancer liver metastasis by driving NK cell infiltration and plasticity

Affiliations

Cxcr3 promotes protection from colorectal cancer liver metastasis by driving NK cell infiltration and plasticity

Eleonora Russo et al. J Clin Invest. .

Abstract

The antimetastatic activity of NK cells is well established in several cancer types, but the mechanisms underlying NK cell metastasis infiltration and acquisition of antitumor characteristics remain unclear. Herein, we investigated the cellular and molecular factors required to facilitate the generation of an ILC1-like CD49a+ NK cell population within the liver metastasis (LM) environment of colorectal cancer (CRC). We show that CD49a+ NK cells had the highest cytotoxic capacity among metastasis-infiltrating NK cells in the MC38 mouse model. Furthermore, the chemokine receptor CXCR3 promoted CD49a+ NK cell accumulation and persistence in metastasis where NK cells colocalize with macrophages in CXCL9- and CXCL10-rich areas. By mining a published scRNA-seq dataset of a cohort of patients with CRC who were treatment naive, we confirmed the accumulation of CXCR3+NK cells in metastatic samples. Conditional deletion of Cxcr3 in NKp46+ cells and antibody-mediated depletion of metastasis-associated macrophages impaired CD49a+NK cell development, indicating that CXCR3 and macrophages contribute to efficient NK cell localization and polarization in LM. Conversely, CXCR3neg NK cells maintained a CD49a- phenotype in metastasis with reduced parenchymal infiltration and tumor killing capacity. Furthermore, CD49a+ NK cell accumulation was impaired in an independent SL4-induced CRC metastasis model, which fails to accumulate CXCL9+ macrophages. Together, our results highlight a role for CXCR3/ligand axis in promoting macrophage-dependent NK cell accumulation and functional sustenance in CRC LM.

Keywords: Cell migration/adhesion; Immunology; Innate immunity; NK cells; Oncology.


Conflict of interest statement

Conflict of interest: The authors have declared that no conflict of interest exists.

Figures

Figure 1
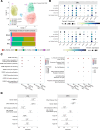
Figure 1. The liver metastasis microenvironment reorganizes type 1 ILC compartment and deeply shapes their transcriptional profile.
(A) Left, representative contour plots of ILC1s (CD49a+CD49b), CD49aNK cells (CD49aCD49b+) and CD49a+NK cells (CD49a+CD49b+) in healthy liver (HL), metastasis-free liver (MFL), and liver metastasis (LM) gated on lin(CD3CD19)CD45+NK1.1+ NKp46+ cells. Right, histograms show mean ± SEM of ILC1, CD49a+ NK, and CD49a NK cell frequency among CD45+ cells in HL, MFL, and LM of MC38-injected tumor-bearing mice. 5 independent experiments with at least 5 mice per group were performed. (n ≥ 15, ILC1 **P = 0.007; CD49a+NK ****P < 0.0001, 1-way ANOVA). (B) Top, gating scheme for cell populations isolated by fluorescence activated cell sorting. Pooled MFL and LM samples from at least 6 mice were collected in 3 independent sortings. Bottom, principal component analysis (PCA) from bulk RNA-seq. (C) Heatmaps showing DEGs involved in regulation of cellular functions. (D) Gene set variation analysis (GSVA) of MFL ILC1 and NK cells and LM CD49a NK cells and CD49a+ NK showing modulation of pathways associated to cell proliferation (E2F targets, G2M checkpoint), activation (IL-15-treated NK cells, TGF-β1, and IFN-α signalling) and metabolism (glycolysis). (E) Representative FACS histogram plots of at least 3 independent analyses for cell surface receptor expression by LM CD49a+ NK cells, ILC1, and CD49a NK cells.
Figure 2
Figure 2. CXCR3 is prevalently expressed by CD49a+ NK cell subsets in human liver metastasis.
(A) Top, Umap showing 5 NK cell clusters from MFL, LM, and PBMC samples identified in the analysis of human CRC dataset from Liu et al. (32). Bottom, frequency of NK cell clusters in MFL, LM, and PBMCs. (B) Dot plots showing gene expression related to cell migration and adhesion in NK cell clusters from MFL and LM. (C) GO analysis in NK cell clusters. (D) Forest plot analysis showing overall survival (OS) and disease-free survival (DSF) of NK_CXCR3 signature applied on colorectal cancer liver metastasis dataset (33).
Figure 3
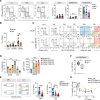
Figure 3. CXCR3 chemokine receptor drives NK cell infiltration in liver metastasis.
(A) Left, representative immunofluorescence image of NKp46+ cell localization relative to endothelial (CD31+) cells (n = 4 mice, scale bar: 50 μm). Right, representative FACS histogram plots and quantification of parenchymal localization of ILC1, CD49a+ NK and CD49a NK cells assessed by CD45 staining upon CD45-PE in vivo injection before mouse sacrifice in MFL and LM. Numbers in FACS plots represent frequency of CD45-PE cells. Histogram bars show mean ± SD of CD45-PE cell frequency among cell populations in a representative experiment (ILC1 *P = 0.02, CD49a+ NK *P = 0.014, 1-way ANOVA) out of 3 performed with a total of 8 mice. (B) Schematics of NK cell competitive adoptive transfer experiments. CFSE+ splenic NK cells from CD45.1 WT and CD45.2 Cxcr3–/– mice were i.v. transferred in healthy control or metastasis-bearing mice at 1:1 ratio. Transferred cells were identified as CFSE+ cells. WT and Cxcr3–/– cells were discriminated according to their CD45 allelic variant. Violin plot shows the relative number of NK cells from WT and Cxcr3–/– mice, expressed as WT/KO ratio of transferred cells in HL, MFL, and LM in 2 independent experiments (HL n = 2, MFL n = 7, and LM n = 3; *P = 0.01, 1-way ANOVA). (C) Representative immunofluorescence staining of LM from 4 mice; in red, NKp46+ cells are indicated by white arrows and CD31+ blood vessels are shown in green. Relative quantification of NKp46+ cells distance from blood vessels in LM of Cxcr3+/+ and Cxcr3–/– mice (**P = 0.0018 2-tailed Student’s t test; scale bar: 50μm).
Figure 4
Figure 4. CD49a+ NK cells accumulate in metastasis parenchyma and acquire features of tissue residency in MC38- but not in SL4-induced metastasis.
(A) Left, representative contour plots of type 1 innate lymphocytes in HL, MFL, and LM of SL4-injected mice gated on lin(CD3CD19)CD45+NK1.1+ NKp46+ cells. Right, histograms show mean ± SEM of ILC1, CD49a+ and CD49a NK cell frequency among CD45+ cells. 3 independent experiments with at least 11 total mice (CD49a+ NK ***P = 0.0008, CD49a NK ***P = 0.0002 2-tailed Student’s t test). (B) Histogram plot shows comparison of mean frequency ± SEM of cells among CD45+ cells in LM from MC38- and SL4-injected mice. (ILC1 *P = 0.02, CD49a+ NK *P = 0.04, CD49a NK **P = 0.006 2-tailed Student’s t test). (C) Left, representative contour plots of ILC1, CD49a+ and CD49a NK cell distribution in vascular (CD45-PE+) and parenchymal (CD45-PE) compartments of MC38- and SL4-induced LM upon CD45-PE in vivo labeling. Middle and right, CD49a, CD11b, and CD69 expression on total CD49b+ cells among CD45-PE+ and CD45-PE cells. (D) Left, histogram plot shows frequency of CD45-PE cells in LM from MC38- and SL4-injected mice (CD49aCD69 **P = 0.001, CD49a+CD69+ **P = 0.001 1-way ANOVA). Right, histogram plot shows a representative experiment of CXCR3 geometric (g) MFI ± SD on NK cell subsets in MC38-induced LM. Three animals per group were analyzed (CD49aCD69 *P = 0.017, CD49aCD69+ **P = 0.0018, CD49a+CD69+ ***P = 0.0004, 1-way ANOVA). (E) Contour plots show CD107a expression by MC38-induced MFL and LM type 1 innate lymphocytes. Histograms show mean frequency ± SEM of CD107a+ cells from 3 independent experiments (MFL: n = 18 ****P < 0.0001, LM: n = 8 CD49a+ NK *P = 0.03, LM CD49a NK *P = 0.01, 1-way ANOVA). (F) Box plot showing frequency of CD107a+ LM CD49a NK cells in MC38- and SL4-derived LM (n = 4 *P = 0.03 2-tailed Student’s t test). (G) Representative experiment out of 3 (in duplicate) showing mean frequency ± SD of MC38 target cell–specific lysis by sorted MFL NK cells and LM CD49a+ and CD49a NK cells.
Figure 5
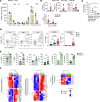
Figure 5. Macrophages showing TAM-like features accumulate in MC38-induced liver metastasis and produce cytokines and chemokines.
(A) Histograms show chemokine concentrations in LM homogenates from MC38- and SL4-injected mice by luminex assay performed in duplicate (n = 3; pg/mg of tissue lysate) (CCL3 *P = 0.01, CCL4 *P = 0.04, KC *P = 0.01, ***P = 0.0007, 2-tailed Student’s t test). (B) Top, quantification of CXCL9, CXCL10, and IL-15/IL-15Ra complex secretion in MFL and LM macrophage- and MC38 cell-conditioned supernatants (n ≥ 2). Bottom, mRNA levels of Il-15 and Il-15Rα expression by macrophages isolated from MFL and LM and by MC38 cells (n = 2). (C) mRNA levels of TGF-β1 expression by MC38- and SL4-derived LM macrophages and MC38 and SL4 cell lines (n = 4, *P = 0.02, 2-tailed Student’s t test). (D) Contour plots show macrophage subsets HL and MC38-derived MFL and LM. Histograms represent mean frequency ± SEM of F4/80int (CD11bhiF4/80int) and F4/80hi cells (CD11bhiF4/80hi) gated on live linCD45+Ly6Clow/–Gr1 from at least 12 total mice. (*P = 0.02, ****P < 0.0001, 1-way ANOVA). (E) Histogram plots show expression of Arg1, MMR, PD-L1, LAP-1, CX3CR1, and MHCII in F4/80int and F4/80hi from MC38-induced LM (Arg1 *P = 0.017, MMR **P = 0.001, PD-L1 *P = 0.02, LAP-1 *P = 0.014, CX3CR1 ***P = 0.0005, MHCII ***P = 0.0001, 2-tailed Student’s t test) (F) Heatmaps showing DEGs from bulk RNA-seq of sorted F4/80hi (violet) and F4/80int (green) macrophages from MC38-derived LM.
Figure 6
Figure 6. F4/80hi MAMs from MC38 but not SL4-induced metastasis include subsets expressing CXCL9 and TGF-β1.
(A) Representative FACS plots of CXCL9 expression on MHCII+ (red) or MHCII (blue) F4/80hi macrophages in LM. Grey, isotype control (IC) staining. Histogram graph shows mean frequency ± SEM of CXCL9+ cells among MHCII+ or MHC-II F4/80hi macrophages in MC38-injected mice (****P < 0.0001, 2-tailed Student’s t test). (B) Comparison of F4/80int and F4/80hi MAM mean frequency ± SEM between MC38-injected and SL4-injected mice (***P = 0.0002, 1-way ANOVA). (C) Mean frequency ± SEM of MHCII+ or MHCII cells among F4/80hi MAMs in MC38- and SL4-induced LM (n > 9, *P = 0.04, **P = 0.001, 1-way ANOVA). (D) Comparison of CXCL9 gMFI and of frequency of LAP-1+ cells on MHCII+ or MHCIIF4/80hi macrophages in MC38- or SL4-injected mice. Mean ± SEM of at least 7 mice per group in 2 independent experiments (gMFI *P = 0.029, LAP-1 ***P = 0.0003, 1-way ANOVA). (E) Correlation between frequency of CD49a+ or CD49a NK cells and matched MHCII+CXCL9+F4/80hi populations among CD45+ cells in LM from MC38-injected mice. Simple linear regression of correlation and Pearson correlation coefficient (R2) are shown (CD49a+ NK P = 0.02, CD49a NK P = 0.62). (F) Immunofluorescence staining of liver metastasis: in blue DAPI staining for nuclei, in red F4/80, in green CXCL9/CXCL10 and in white NKp46. Top (original magnification, ×20), dotted line indicates tumor margin. Bottom, images at original magnification, ×63, with corresponding insets.
Figure 7
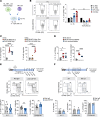
Figure 7. MAMs specifically induce acquisition of CD49a+ NK cell features by NK cells in a TGF-β1–mediated manner.
(A) Experimental scheme of macrophage-NK cell coculture in vitro. (B) Lef,: representative contour plot of CD49a and CD49b expression by NK cells upon 72 hours coculture with macrophages purified from HL and LM with or without TGF-β-RI inhibitor (SB431542, 2.5 nM). Right, fold change (F.C.) of frequency ± SEM of CD49a+ cells among NK cells cultured with macrophages from HL, MFL, or LM relative to NK cells cultured alone (IL-15 *P = 0.03, IL-15+TGF-β-RI inhibitor *P = 0.044, 2-tailed Student’s t test in HL Mac versus LM Mac in IL-15 and LM Mac in IL-15 versus IL-15+ TGF-β-RI inhibitor). 3 experiments were performed in duplicate. (C) Left, percent of migration of splenic NK cells in response to supernatants collected from MC38- or SL4-derived LM macrophages and no chemokine control (NC) (n > 3, *P = 0.01, ****P < 0.0001, 1-way ANOVA). Right, percent of migration in response to MC38-derived MFL, LM macrophage supernatants and NC (n > 3, ****P < 0.0001, 1-way ANOVA). (D) Fold change of CD49a (left) and frequency of CD49a+CD69+ cells (right) in NK cells cultured alone or with LM-derived macrophages from MC38 and SL4 LM (n = 5, *P < 0.02, ****P < 0.0001, 1-way ANOVA). (E and F) Top, experimental workflow of in vivo treatment with anti-CSF1R and with MC-21. (E) Bottom, representative contour plots show ILC1, CD49a+ and CD49a NK cells in LM of control mAb (Rat IgG2a)-treated and anti-CSF1R-treated tumor-bearing mice. Numbers in plots indicate frequency among NK1.1+NKp46+ cells. Histogram plots show mean frequency ± SEM (n = 9 total mice in 2 independent experiments, CD49a+ NK **P = 0.003, CD49aNK *P = 0.02, 2-tailed Student’s t test). (F) Bottom, representative contour plots show ILC1, CD49a+, and CD49aNK cells in LM of control mAb (Rat IgG2a)-treated and MC-21–treated tumor-bearing mice. Numbers in plots indicate frequency among NK1.1+ NKp46+ cells. Histogram plots show mean frequency ± SEM (n = 4, 2 independent experiments were performed).
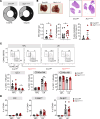
Figure 8
Figure 8. Deletion of Cxcr3 in Ncr1+ ILCs impairs CD49a+ NK generation and accelerates metastasis formation.
(A) Cake plots show incidence of LM in Cxcr3fl/fl and Ncr1ΔCxcr3 mice 15 days p.i. 2 independent experiments were performed. (B) Top, representative pictures of metastatic livers and hematoxylin-eosin staining. Bottom, scatter plots show mean ± SEM of metastasis weight (gr) and number and quantification of liver section from Cxcr3fl/fl (grey) and Ncr1ΔCxcr3 (red) mice 20 days p.i. 3 independent experiments were performed (Met Weight *P = 0.012, no. metastases *P = 0.022, 2-tailed Student’s t test). (C) Representative contour plots of ILC1, CD49a+ NK and CD49a NK cells in MFL and LM from Cxcr3fl/fl and Ncr1ΔCxcr3 mice. Numbers in plots correspond to frequency. Histograms show corresponding median frequency with 95% CI among NK1.1+ NKp46+ cells (ILC1 *P = 0.026, CD49a+ NK **P = 0.0015, 2-tailed Student’s t test to compare Cxcr3fl/fl and Ncr1ΔCxcr3 cell frequency). (D) Histogram plots show frequency of DCs, F4/80int and F4/80hi macrophages in MFL and LM of Cxcr3fl/fl and Ncr1ΔCxcr3 tumor-bearing mice among CD45+ cells. Data are presented as mean ± SEM. Three independent experiments were performed.

References

    1. Riihimaki M, et al. Patterns of metastasis in colon and rectal cancer. Sci Rep. 2016;6:29765. doi: 10.1038/srep29765. - DOI - PMC - PubMed
    1. Peng H, et al. Liver-resident NK cells confer adaptive immunity in skin-contact inflammation. J Clin Invest. 2013;123(4):1444–1456. doi: 10.1172/JCI66381. - DOI - PMC - PubMed
    1. Lopes N, et al. Tissue-specific transcriptional profiles and heterogeneity of natural killer cells and group 1 innate lymphoid cells. Cell Rep Med. 2022;3(11):100812. doi: 10.1016/j.xcrm.2022.100812. - DOI - PMC - PubMed
    1. Lopez-Soto A, et al. Control of metastasis by NK Cells. Cancer Cell. 2017;32(2):135–154. doi: 10.1016/j.ccell.2017.06.009. - DOI - PubMed
    1. Zhang S, et al. Prognostic significance of tumor-infiltrating natural killer cells in solid tumors: a systematic review and meta-analysis. Front Immunol. 2020;11:1242. doi: 10.3389/fimmu.2020.01242. - DOI - PMC - PubMed

MeSH terms