. 2025 Mar 31;17(4):1026-1042.
doi: 10.18632/aging.206232. Epub 2025 Mar 31.

Mesenchymal stem cell-specific Sirt1 overexpression prevents sarcopenia induced by 1,25-dihydroxyvitamin D deficiency

Affiliations

Mesenchymal stem cell-specific Sirt1 overexpression prevents sarcopenia induced by 1,25-dihydroxyvitamin D deficiency

Haiyun Chen et al. Aging (Albany NY). .

Abstract

Sarcopenia, characterized by an age-related decline in skeletal muscle mass and function, is closely linked to vitamin D deficiency. This study examines the role of Sirtuin 1 (Sirt1) and its regulation by vitamin D in preventing sarcopenia. Utilizing wild-type, 1α-hydroxylase knockout (1α(OH)ase-/-), and Sirt1 transgenic (Sirt1Tg) 1α(OH)ase-/- mice, we investigated muscle Sirt1 levels, muscle mass, fiber type, and senescence markers. Our results demonstrated that 1,25-Dihydroxyvitamin D (1,25(OH)2D3) upregulated Sirt1 and myogenic factor MyoD1 expression in C2C12 myoblasts via VDR-mediated transcription. Sirt1 overexpression in mesenchymal stem cells (MSCs) significantly mitigated muscle mass reduction, improved fiber cross-sectional area, and increased type II fiber numbers in 1α(OH)ase-/- mice. Mechanistically, 1,25(OH)2D3 promoted muscle cell health by enhancing Sirt1 expression, which in turn reduced muscle cell senescence and the senescence-associated secretory phenotype (SASP) through decreased levels of acetylated nuclear p53 and p65, maintaining their cytoplasmic localization. Additionally, Sirt1 overexpression accelerated muscle regeneration post-injury by increasing embryonic myosin heavy chain expression and cell proliferation. These findings underscore the therapeutic potential of targeting vitamin D and Sirt1 pathways to prevent sarcopenia, suggesting that supplementation with active vitamin D and consequent Sirt1 activation could be effective strategies for managing age-related muscle wasting.

Keywords: Myod1; Sirt1; active vitamin D; muscle regeneration; sarcopenia.


Conflict of interest statement

CONFLICTS OF INTEREST: The authors declare no conflicts of interest related to this study.

Figures

Figure 1
Figure 1
1,25(OH)2D3 upregulates Sirt1 expression in C2C12 cells via VDR-mediated transcription. (A) Western blot showing changes in Sirt1 and 1α(OH)ase protein expression levels in tibialis anterior muscle tissues of 2-month-old WT, 1α(OH)ase−/− and Sirt1Tg1α(OH)ase−/− mice and (B) statistical analysis results of Sirt1 protein expression levels. (C) 1,25(OH)2D3 treatment upregulated Sirt1 gene expression in C2C12 cells. (Each experiment was conducted in five replicates). (D) VDR binding sites were predicted in the Sirt1 promoter region (yellow area). (E) ChIP-qPCR results showing enrichment of Sirt1 in VDR immunoprecipitation. (F) Schematic diagram of luciferase reporter gene plasmids containing the Sirt1 promoter region. (G) Luciferase activity results. **p < 0.01; ***p < 0.001.
Figure 2
Figure 2
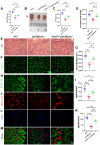
Sirt1 overexpression in MSCs corrects skeletal muscle mass reduction, muscle fiber atrophy and type II fiber loss caused by 1,25(OH)2D deficiency. (A) Body weight results, (B) gross images of tibialis anterior (TA) muscles and (C) muscle weight results. (D) Tibialis anterior muscle weight/body weight results from 2-month-old WT, 1α(OH)ase−/− and Sirt1Tg1α(OH)ase−/− male mice. (E) H&E staining micrographs. (F) Laminin immunofluorescence staining micrographs. (G) Tibialis anterior muscle cross-sectional area analysis results. (H) Tibialis anterior muscle MyHC II B immunofluorescence staining micrographs and (I) MyHC II B positive fiber number analysis. (J) Tibialis anterior muscle MyHC II A immunofluorescence staining micrographs and (K) MyHC II A positive fiber number analysis. (L) DAPI staining of tibialis anterior muscle sections. (M) Merged images of MyHC II B, MyHC II A and DAPI immunofluorescence staining in tibialis anterior muscle. 6 mice per group were used for experiments. *p < 0.05; **p < 0.01; ***p < 0.001.
Figure 3
Figure 3
Sirt1 overexpression in MSCs corrects satellite cell reduction and skeletal muscle cell senescence caused by 1,25(OH)2D deficiency. (A) DAPI, Laminin and Pax7 immunofluorescence staining micrographs of tibialis anterior muscle from 2-month-old WT, 1α(OH)ase−/− and Sirt1Tg1α(OH)ase−/− male mice. (B) Statistical analysis of Pax7 positive cells in tibialis anterior muscle. (C) DAPI, Laminin and p16 immunofluorescence staining micrographs. (D) p16 positive cell analysis results. (E) DAPI, Laminin and p21 immunofluorescence staining micrographs from tibialis anterior muscle of 2-month-old mice of three genotypes. (F) p21 positive cell analysis results. 6 mice per group were used for experiments. *p < 0.05, **p < 0.01, ***p < 0.001.
Figure 4
Figure 4
Sirt1 overexpression in MSCs corrects senescence-associated secretory phenotype (SASP) in skeletal muscle caused by 1,25(OH)2D deficiency. (A) DAPI, Laminin and p65 immunofluorescence staining micrographs of tibialis anterior muscle from 2-month-old male mice of three genotypes and (B) p65 positive cell analysis results. (C) Western blot showing changes in p16, p21, p65 and IL-1α protein levels in tibialis anterior muscle and (D) quantitative analysis of protein levels. 6 mice per group were used for experiments. *p < 0.05; **p < 0.01; ***p < 0.001.
Figure 5
Figure 5
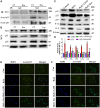
1,25(OH)2D3 or resveratrol inhibits C2C12 cell senescence and SASP by activating Sirt1 to decrease acetylated p53 and p65 levels and activities. (A) C2C12 cells were treated with 10 µM Resveratrol (Res) and Sirt1 protein immunoprecipitation followed by Western blot analysis of Sirt1, Acel-p53 and Aceyl-p65 expression. (B) Western blot analysis of Sirt1, p53 and p65 protein levels in whole cell lysates (WCL). (C) C2C12 cells were treated with 100 µM H2O2 alone or together with 10−8M 1,25(OH)2D3 or 10 µM Resveratrol for 24 hours, proteins were extracted and p16, p53, p65, IL-1α and IL-6 levels were determined by Western blot. (D) Quantitative analysis of protein levels. Experiments were performed in triplicate. *p < 0.05; ***p < 0.001 compared to control; #p < 0.05; ##p < 0.01; ###p < 0.001 compared to H2O2 alone. (E) Immunofluorescence staining showing subcellular localization of Acel-p53. (F) Immunofluorescence staining showing subcellular localization of Aceyl-p65.
Figure 6
Figure 6
Sirt1 overexpression in MSCs accelerates skeletal muscle injury repair by promoting regeneration. (A) H&E staining micrographs of tibialis anterior muscle frozen sections from 2-month-old WT and Sirt1Tg mice after barium chloride (BaCl2) injury. (B) eMyHC/Laminin/DAPI immunofluorescence staining micrographs and (C) relative eMyHC+ newborn fiber area analysis. (D) BrdU/Laminin/DAPI immunofluorescence staining micrographs and (E) BrdU positive fiber number analysis. (F) Western blot analysis of Sirt1, p53, p65, IL-6 and Mmp3 protein levels in muscle tissues after BaCl2 injury and (G) quantitative protein analysis. 6 mice per group were used for experiments. *p < 0.05; **p < 0.01; ***p < 0.001 compared to WT + BaCl2.
Figure 7
Figure 7
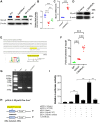
1,25(OH)2D3 up-regulates the expression of Myod1 in C2C12 cells through VDR-mediated transcription. (A) Western blot showing changes in Myod1 protein levels in tibialis anterior muscles of 2-month-old WT, 1α(OH)ase−/− and Sirt1Tg1α(OH)ase−/− mice and (B) quantitative analysis. (C, D) 10−8 M 1,25(OH)2D3 treatment upregulates Myod1 gene and protein expression in C2C12 cells. (Each experiment was conducted in five replicates). (E) Predicted VDR binding site (highlighted in yellow) in the Myod1 promoter region. (F) qPCR results showing enrichment of Myod1 in VDR chromatin immunoprecipitation. (G) Agarose gel electrophoresis of ChIP PCR products. (H) Schematic diagram showing construction of luciferase reporter plasmids containing the Myod1 promoter region. (I) Luciferase activity analysis. Each experiment was performed in triplicate. *p < 0.05; ***p < 0.001, compared to control; #p < 0.05; ###p < 0.001, compared to 1α(OH)ase−/− mice or Vehicle.

References

    1. Anker SD, Morley JE, von Haehling S. Welcome to the ICD-10 code for sarcopenia. J Cachexia Sarcopenia Muscle. 2016; 7:512–4. 10.1002/jcsm.12147 - DOI - PMC - PubMed
    1. Cruz-Jentoft AJ, Sayer AA. Sarcopenia. Lancet. 2019; 393:2636–46. 10.1016/S0140-6736(19)31138-9 - DOI - PubMed
    1. Dennison EM, Sayer AA, Cooper C. Epidemiology of sarcopenia and insight into possible therapeutic targets. Nat Rev Rheumatol. 2017; 13:340–7. 10.1038/nrrheum.2017.60 - DOI - PMC - PubMed
    1. Han A, Bokshan SL, Marcaccio SE, DePasse JM, Daniels AH. Diagnostic Criteria and Clinical Outcomes in Sarcopenia Research: A Literature Review. J Clin Med. 2018; 7:70. 10.3390/jcm7040070 - DOI - PMC - PubMed
    1. Agarwal A, Gupta SK, Sukumar R. Hyperparathyroidism and malnutrition with severe vitamin D deficiency. World J Surg. 2009; 33:2303–13. 10.1007/s00268-009-0044-0 - DOI - PubMed

MeSH terms