Clinical Trial
. 2025 Apr 1;16(1):3137.
doi: 10.1038/s41467-025-58321-4.

Severe inflammation and lineage skewing are associated with poor engraftment of engineered hematopoietic stem cells in patients with sickle cell disease

Affiliations
Clinical Trial

Severe inflammation and lineage skewing are associated with poor engraftment of engineered hematopoietic stem cells in patients with sickle cell disease

Steicy Sobrino et al. Nat Commun. .

Abstract

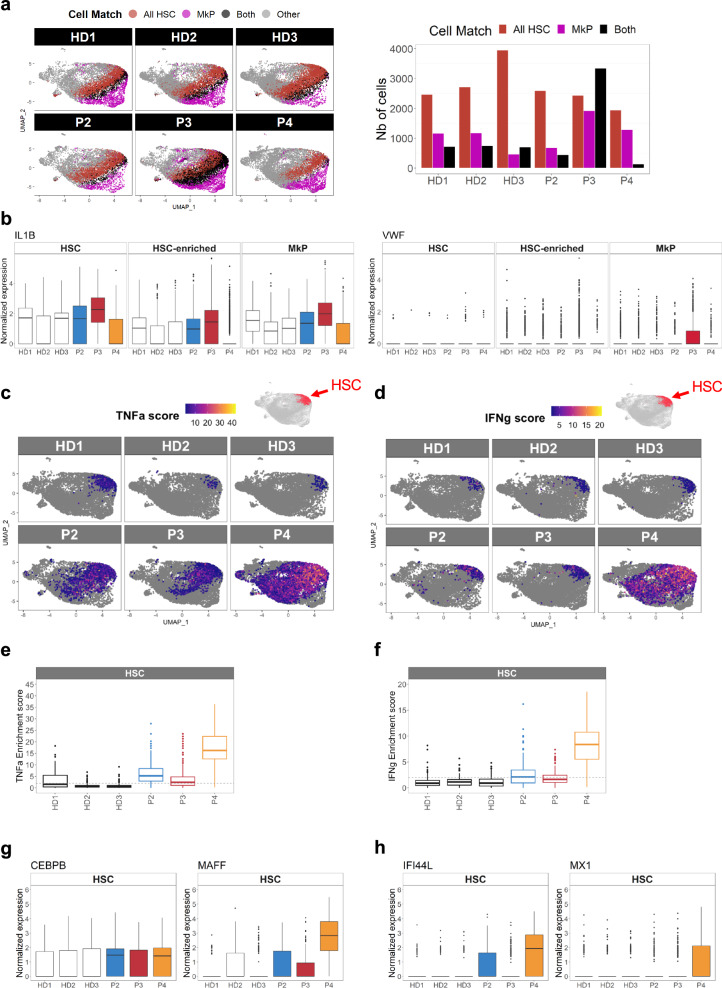
In sickle cell disease (SCD), the β6Glu→Val substitution in the β-globin leads to red blood cell sickling. The transplantation of autologous, genetically modified hematopoietic stem and progenitor cells (HSPCs) is a promising treatment option for patients with SCD. We completed a Phase I/II open-label clinical trial (NCT03964792) for patients with SCD using a lentiviral vector (DREPAGLOBE) expressing a potent anti-sickling β-globin. The primary endpoint was to evaluate the short-term safety and secondary endpoints included the efficacy and the long-term safety. We report on the results after 18 to 36 months of follow-up. No drug-related adverse events or signs of clonal hematopoiesis were observed. Despite similar vector copy numbers in the drug product, gene-marking in peripheral blood mononuclear cells and correction of the clinical phenotype varied from one patient to another. Single-cell transcriptome analyses show that in the patients with poor engraftment, the most immature HSCs display an exacerbated inflammatory signature (via IL-1 or TNF-α and interferon signaling pathways). This signature is accompanied by a lineage bias in the HSCs. Our clinical data indicates that the DREPAGLOBE-based gene therapy (GT) is safe. However, its efficacy is variable and probably depends on the number of infused HSCs and intrinsic, engraftment-impairing inflammatory alterations in HSCs. Trial: NCT03964792.


Conflict of interest statement

Competing interests: The authors declare no competing interests.

Figures

Fig. 1
Fig. 1. The NCT03964792 phase I/II Open Label Study and the characterization of the DP.
a Flow diagram of the DREPAGLOBE study (NCT03964792). b Gating strategy to identify HSCs using flow cytometry. We plotted the frequency of HSCs in the DP (c) the number of infused HSCs/kg (d) and the number of infused corrected HSCs/kg (e). Source data are provided as a Source Data file.
Fig. 2
Fig. 2. Gene marking and hemoglobin expression.
a VCN kinetics in neutrophils. b Hb concentrations in patients’ blood. c Kinetics of HbAS3, as assessed by CE-HPLC analysis. d Proportions of Hb species (as assessed by CE-HPLC) in reticulocytes vs. RBCs. M, months after GT. e Proportion of HbAS3+ circulating RBCs measured by flow cytometry after intracellular co-staining using specific fluorescent monoclonal antibodies directed against HbS and HbA (the latter antibody also recognizes HbA2, which, however, is expressed at very low levels, and HbAS3). Results were obtained by considering only the HbS+ sub-populations to exclude RBCs from transfusion. The p-value for the difference between P1 and P3 is equal to 0.0199, between P2 and P3 is <0.0001 and between P2 and P4 is equal to 0.0239. f Mean proportion of HbAS3 per RBC, expressed in percentage of total hemoglobin, in HbAS3+ cells (calculated using the formula: HbAS3%-assessed by HPLC/HbAS3+-RBC%-assessed by flow cytometry × 100). The p-value for the difference between P2 and P3 is inferior to <0.0001 and between P2 and P4 is equal to 0.0031. g Mean amount of HbAS3 per RBC, expressed in picograms, in HbAS3+ cells (calculated using the formula: HbAS3%-assessed by HPLC × MCH/HbAS3 + -RBC%-assessed by flow cytometry). The p-value between for the difference P2 and P3 is equal to 0.0032 and between P2 and P4 is equal to 0.0009. h Correlation between the mean amount of HbAS3 per RBC and the VCN in CD15+ cells. i Difference in the proportion of HbAS3+ reticulocytes (CD71+ cells), measured by flow cytometry. Histograms in (ei) represent mean ± standard deviation of multiple time-points measured from month 5 post-GT (time at which HbA from RBC transfusions was no longer detectable in P1 and P2). The p-value for the difference between P2 and P3 is equal to 0.0026 and between P2 and P4 is equal to 0.0010. *p < 0.05, **p < 0.01, ***p < 0.001, and ****p < 0.0001 by Kruskal-Wallis test. Source data are provided as a Source Data file.
Fig. 3
Fig. 3. Characterization of HSPC composition and gene signatures in SCD patients vs HD cells by bulk and single-cell RNA-seq.
a, b RNA-seq data were analyzed using DESeq2. We performed a two-sided hypergeometric test with MSigDB after correction for multiple hypothesis testing according to Benjamini and Hochberg on the DEG using Hallmark or custom genesets from published transcriptomic data,, (Log2FC > 1.2, FDR < 0.05). a Top 10 enriched Hallmark genesets in SCD vs HDs HSPCs. b Top 5 enriched custom HSPC genesets in SCD vs HDs HSPCs. Red, upregulated genes in SCD and blue, downregulated genes in SCD in comparison with HDs. c, d Representation and quantification of modules of genesets activity with ROMA tool in individual HSPC samples using selected hallmark and gene ontology genesets (c) and custom genesets (d). Red arrows indicate inflammatory genesets. e Unsupervised analysis of 54,689 HSPCs and 15,961 genes from 3 HDs and 3 patients with SCD, represented as two-dimensional UMAP plots. Each individual cell in our dataset was annotated using the Cell-ID method and reference BM HSPC signatures. HSC hematopoietic stem cell, HSC-enriched hematopoietic stem cell-enriched, MPP multipotent progenitors, MLP multipotent lymphoid progenitors, ImP1 & ImP2 immature myeloid progenitors, NeutroP neutrophil progenitors, MonoDCP monocyte and dendritic cell progenitors, BcellP B cell progenitors, MEP megakaryocyte and erythrocyte progenitors, EryP erythroid progenitors, MkP megakaryocyte progenitors, EoBasMastP eosinophil, basophil and mast cell progenitors, NA not annotated. f Proportion of the HSCs per individual. g Top 10 pathways (in terms of p-value, identified using a two-sided hypergeometric test, MSigDB and hallmark genesets) among the 280 DEGs identified with the MAST tool in SCD HSCs (n = 3) vs. HD HSCs (n = 3). In each pathway, genes that are upregulated in SCD (relative to HDs) are shown in red, and those that are downregulated in SCD are shown in blue. The false discovery rate (−log10(adjusted p-value)) is shown for each pathway. The numbers of upregulated and downregulated genes in each pathway are also shown. h, i Bar plots showing the percentages of NeutroP-MonoDCP (h) and MEP-MkP (i) in each individual.
Fig. 4
Fig. 4. IL1b-driven megakaryocytic-biased HSCs in P3 and TNFa and IFN driven myeloid- bias HSCs in P4.
The Cell-ID method was used to assess the statistical enrichment of individual-cell gene signatures vs. signaling pathway gene sets (such as Hallmark gene sets, MSigDB collections, v7.5.1) based on two-sided hypergeometric test p-values with Benjamini–Hochberg correction for the number of tested gene signatures. Enrichment scores were calculated as the -log10(p-value). a UMAP plots highlighting cells significantly matching the All HSC and MkP signatures, for each HD (n = 3) and SCD patient (n = 3) (p < 0.05). Cells matching All HSC and MkP cell types are shown in black, and cells matching with only one cell type are shown in red (All HSC) and pink (MkP). The number of cells in each category and per patient, is depicted in the histogram on the right. b Boxplots of IL1β and VWF mRNA expression in HSCs, HSC-enriched and MkP populations, in each HD (n = 3) and SCD patient (n = 3). c, d UMAP plots of TNFa and IFN gamma response pathway enrichment scores for each HD (n = 3) and SCD patient (n = 3), determined with Cell-ID. e, f Boxplots representing significant TNFa and IFN gamma enrichment scores (p < 0.01) in HSCs for each HD (n = 3) and SCD patient (n = 3). Dotted lines represent the significant threshold -log10(p-value = 0.01). g, h Boxplot representing CEBPB, MAFF, IFI44L, and MX1 mRNA expression in the HSCs populations in each HD (n = 3) and SCD patient (n = 3). In each boxplot, the edges of the box indicate the first and third quartiles and the center line indicates the data median. The whiskers denote 1.5× interquartile range, data beyond the end of the whiskers are called “outlying” points and are plotted individually.
Fig. 5
Fig. 5. Anti-inflammatory treatment reduces inflammation in P3 and P4 HSPCs.
Transcriptomic analysis of HSPCs from P3 and P4 (untreated or treated with JAK inhibitors: Ruxolitinib, Ruxo, or Baricitinib, Bari or TNF inhibitors: Infliximab, Inflix or Etanercept, Etaner), and HDs (n = 2) using two-sided hypergeometric test with MSigDB after correction for multiple hypothesis testing according to Benjamini and Hochberg on the DEG using Hallmark genesets (Log2FC > 1.2, FDR < 0.05). a Top 10 enriched Hallmark genesets in untreated patients vs HDs HSPCs cultured for 48 h. b–d Enriched genesets (identified in a) in untreated vs treated patients HSPCs (b, Ruxo, c, Bari, d, Inflix). e–g Enriched genesets (identified in a) in treated patients HSPCs (e, Ruxo, f, Bari, g, Inflix) vs untreated HDs HSPCs. h Histogram representation of the Log2FC of 8 inflammatory dysregulated genes (Patients vs HDs). UT: Log2FC in untreated patients’ HSPCs vs HDs HSPCs. +Ruxo /+Bari /+Inflix /+Etaner: Log2FC in treated patients’ HSPCs vs untreated HDs HSPCs. Source data are provided as a Source Data file.

References

    1. Miccio, A. et al. In vivo selection of genetically modified erythroblastic progenitors leads to long-term correction of beta-thalassemia. Proc. Natl. Acad. Sci. USA105, 10547–10552 (2008). - PMC - PubMed
    1. Miccio, A. et al. The GATA1-HS2 enhancer allows persistent and position-independent expression of a β-globin transgene. PLoS ONE6, e27955 (2011). - PMC - PubMed
    1. Marktel, S. et al. Intrabone hematopoietic stem cell gene therapy for adult and pediatric patients affected by transfusion-dependent ß-thalassemia. Nat. Med.25, 234–241 (2019). - PubMed
    1. Levasseur, D. N. et al. A recombinant human hemoglobin with anti-sickling properties greater than fetal hemoglobin. J. Biol. Chem.279, 27518–27524 (2004). - PubMed
    1. Ribeil, J.-A. et al. Gene therapy in a patient with sickle cell disease. N. Engl. J. Med.376, 848–855 (2017). - PubMed

Publication types

MeSH terms

Associated data