. 2025 Apr 1;16(1):3121.
doi: 10.1038/s41467-025-57077-1.

A genotype-first approach identifies high incidence of NF1 pathogenic variants with distinct disease associations

Affiliations

A genotype-first approach identifies high incidence of NF1 pathogenic variants with distinct disease associations

Anton Safonov et al. Nat Commun. .

Abstract

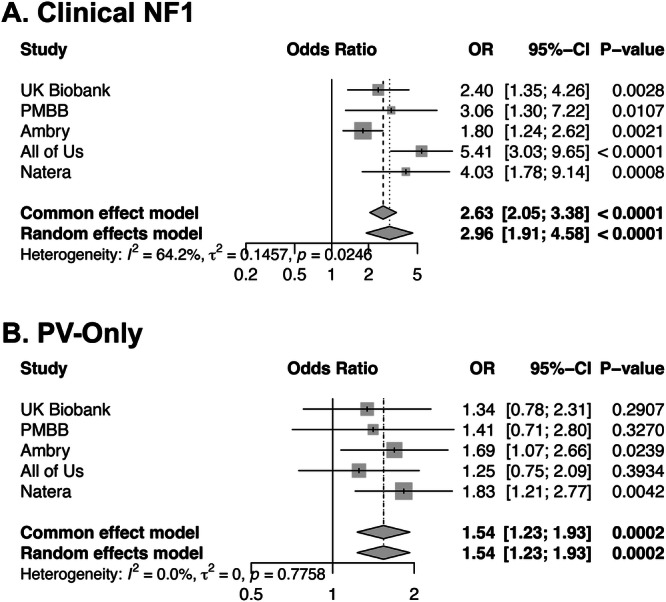
Loss of function variants in the NF1 gene cause neurofibromatosis type 1, a genetic disorder characterized by complete penetrance, characteristic physical exam findings, and a substantially increased risk for malignancy. However, our understanding of the disorder is based on patients ascertained through phenotype-first approaches, which estimate prevalence at 1 in 3000. Leveraging a genotype-first approach in multiple large patient cohorts including over one million individuals, we demonstrate an unexpectedly high prevalence (1 in 1,286) of NF1 pathogenic variants. Half are identified in individuals lacking clinical features of NF1, with many appearing to have post-zygotic mosaicism for the identified variant. Incidentally discovered variants are not associated with classic neurofibromatosis features but are associated with an increased incidence of malignancy compared to control populations. Our findings suggest that NF1 pathogenic variants are substantially more common than previously thought, often characterized by somatic mosaicism and reduced penetrance, and are important contributors to cancer risk in the general population.


Conflict of interest statement

Competing interests: E.C., C.H., J.S.D., A.Y., M.R., V.S., and S.L. are employees of Ambry Genetics. K.L., J.Z., C.B.S., A.E., and Y.S. are employees of Natera Inc. J.W. is a consultant for Natera Inc. The authors declare no other competing interests.

Figures

Fig. 1
Fig. 1. NF1 variants identified in the present study.
The NF1 variants identified in (A) the PMBB dataset and (B) the Ambry dataset are displayed along a schematic of the NF1 protein. In each case, NF1 variants identified in the Clinical-NF1 group are indicated along the top of the protein schematic, whereas those identified in the PV-Only group are indicated along the bottom. Variants labeled with an asterisk were identified in both Clinical-NF1 and PV-Only individuals within each dataset. Variants are color-coded by predicted protein effect, with the height of each line segment corresponds to the number of individuals in which the indicated variant was identified. Large deletions and duplications are indicated by red and blue bars, respectively. Amino acid position, based on NP_001035957, are indicated along the protein schematic. NF1 protein domains are indicated, as follows: CSRD Cysteine-and-Serine-Rich Domain, TBD Tubulin-Binding Domain, GRD GAP-Related Domain, Sec Sec14 Homologous Domain, PH Pleckstrin Homologous Domain, CTD C-terminal Domain, NLS Nuclear Localization Signal.
Fig. 2
Fig. 2. Characterization of somatic mosaicism of NF1 PVs in the PMBB and Ambry datasets.
A The variant allele fraction (VAF) for each NF1 PV identified in individuals in the Clinical-NF1 group (left, blue, n = 22) and PV-Only group (right, pink, n = 34) are displayed for PMBB. Box plots illustrate the median, first and third quartiles, minimum, and maximum for each group. Individuals for whom VAF could nto be determined are excluded. The difference in means between the two groups was statistically significant by 2-sided linear regression (p = 4.54e-06). B Comparison of NF1 PV VAF, as in (A), but for the Ambry data; individuals in the Clinical-NF1 group (n = 145) are shown on the left in green and individuals in the PV-Only group (n = 112) are shown on the right in orange. Individuals for whom VAF could not be determined are excluded. Box plots illustrate the median, first and third quartiles, minimum, and maximum for each group. The difference in means between the two groups was statistically significant by 2-sided linear regression (p = 7.1e12). C 2-sided linear regression of patient age, in years (horizontal axis), against NF1 PV VAF (vertical axis) for the PMBB PV-Only group. Each point represents a single individual. The regression line is shown, with gray shading illustrating the 95% confidence intervals. There is no significant correlation between the two variables (Pearson correlation coefficient of −0.03, p = 0.66). D 2-sided linear regression of patient age against NF1 PV VAF as in (B), but for the 47 Ambry PV-Only patients with a mosaic NF1 PV. Each point represents a single individual. The regression line is shown, with gray shading illustrating the 95% confidence intervals. There is no significant correlation between the two variables (Pearson correlation coefficient of −0.02, p = 0.64). E The distribution of patient ages at time of genetic testing, in years (horizontal axis) for all 43,559 PMBB participants without an NF1 PV (gray) and for the 35 individuals in the PMBB PV-Only group (pink). There is no significant difference in the distribution of patient ages between the two groups by the 2-sided Wilcoxon rank sum test (p = 0.11). F The distribution of patient ages at time of genetic testing for all 118,709 Ambry patients tested with MGPTs containing the NF1 gene (gray) and the 46 individuals in the Ambry PV-Only group with confirmed mosaic NF1 PVs (orange). The Ambry PV-Only group with mosaic NF1 PVs is significantly older than the overall Ambry cohort by the 2-sided Wilcoxon rank sum test (p = 4.3e-06).
Fig. 3
Fig. 3. PheWAS Results for NF1 PV carriers in the PMBB cohort.
Phenome-wide association studies (PheWAS) were performed to identify ICD-10 code phenotypes significantly enriched within NF1 PV carriers in PMBB. In (A, B), individual ICD-10 phenotypes are indicated along the horizontal axis with each point (colored by phenotype group) representing a single ICD-10 code. The height of each point along the vertical axis corresponds to the strength of association for that phenotype with NF1 PV carrier status, with the p value of association (unadjusted) indicated along the vertical axis. The Bonferroni-corrected p value significance threshold of 5.5e-6 (correcting for testing across 9436 individual ICD-10 codes) is indicated by red horizontal dashed lines. In both panels, data represent results of two-sided logistic regression. A PheWAS results for all 58 NF1 PV carriers in PMBB are displayed. Phenotype associations surpassing the Bonferroni-corrected significance threshold are labeled (ICD-10 codes with similar descriptions are labeled as groups; more detailed results can be found in Supplementary Data 8). B The top portion of the Miami plot illustrates results of PheWAS analysis excluding the 35 NF1 PV carriers in the PV-Only group; the bottom portion of the plot illustrates results of repeat PheWAS analysis excluding the 23 NF1 PV carriers in the Clinical-NF1 group. More detailed results can be found in Supplementary Data 9, 10.
Fig. 4
Fig. 4. Comparison of cancer-related phenotypes between the Clinical-NF1, PV-Only, and Tested-Negative groups in the Ambry cohort.
For all panels, statistically significant differences between groups are labeled. In all cases, 2-sided linear (for continuous response variables) or 2-sided logistic regression (for categorical response variables) models were adjusted for patient age. Unadjusted p values are shown. A Percent of patients within each group (Clinical-NF1 in green, PV-Only in orange, and Tested-Negative in gray) reporting a personal history of malignancy. B Mean number of primary malignancies, per patient, across the three groups; Clinical NF1 (n = 152), PV-Only (n = 129) and Tested Negative (n = 31,599). Error bars represent standard deviation. C Comparison of age at first cancer diagnosis between each group. Box plots illustrate the median, first and third quartiles, minimum, and maximum for each group, Clinical NF1 (n = 152), PV-Only (n = 129), and Tested Negative (n = 31,599). For the Clincal-NF1 and PV-Only group, individual data points are shown. PV-Only individuals with mosaic NF1 PVs are shown in red. D Percent of individuals, per group, affected by each of 14 different malignancies. Note that for 28 independent comparisons, a strict Bonferroni-corrected significance threshold of 0.0018 should be considered. E Mean age at first breast cancer (Clinical NF1 n = 84; PV-Only n = 74; Tested Negative n = 15,466) and ovarian cancer (Clinical NF1 n = 9; PV-Only n = 13; Tested Negative n = 1430) diagnosis across the three groups. Error bars represent standard deviation. F Incidence, across the three groups, of different breast cancer receptor statuses among patients for whom a diagnosis of breast cancer was reported and sufficient receptor status information was provided. HR hormone receptor, HER2 human epidermal growth factor receptor 2, TNBC triple negative breast cancer.
Fig. 5
Fig. 5. Forest plot of odds ratios for the association of NF1 mutations with personal history of malignancy across multiple cohorts for both the Clinical-NF1 and PV-Only groups.
A Forest plot showing the odds ratios (OR, indicated as a vertical tick), 95% confidence intervals (95%–CI, indicated as a horizontal line), and unadjusted p values, derived from 2-sided logistic regression, for personal history of malignancy within in the Clinical-NF1 group, compared to the Tested-Negative group, from five different cohorts: UK Biobank, PMBB, Ambry, All of Us, and Natera. The size of the boxes represents the weight of each study in the meta-analysis, with larger boxes corresponding to studies with higher precision (i.e., smaller standard errors). The overall combined OR and CI are shown at the bottom of the plot as diamonds, summarizing the meta-analysis results under both fixed-effect and random-effects models. The tau-squared (τ²) and I² statistics indicate the level of heterogeneity between the studies, with I² describing the percentage of total variation across studies due to heterogeneity rather than chance. B Forest plot showing the odds ratios (OR, indicated as a vertical tick), 95% confidence intervals (95%–CI, indicated as a horizontal line), and unadjusted p values, derived from 2-sided logistic regression, for personal history of malignancy within in the PV-Only group, compared to the Tested-Negative group, from five different cohorts: UK Biobank, PMBB, Ambry, All of Us, and Natera. The size of the boxes represents the weight of each study in the meta-analysis, with larger boxes corresponding to studies with higher precision (i.e., smaller standard errors). The overall combined OR and CI are shown at the bottom of the plot as diamonds, summarizing the meta-analysis results under both fixed-effect and random-effects models. The tau-squared (τ²) and I² statistics indicate the level of heterogeneity between the studies, with I² describing the percentage of total variation across studies due to heterogeneity rather than chance. In both cases, the meta-analysis shows a significantly increased odds of personal history of malignancy in association with the presence of an NF1 PV.

Update of

References

    1. Kiuru, M. & Busam, K. J. The NF1 gene in tumor syndromes and melanoma. Lab. Investig.97, 146–157 (2017). - PMC - PubMed
    1. Sabbagh, A. et al. Unravelling the genetic basis of variable clinical expression in neurofibromatosis 1. Hum. Mol. Genet.18, 2768–2778 (2009). - PMC - PubMed
    1. Karaconji, T., Whist, E., Jamieson, R. V., Flaherty, M. P. & Grigg, J. R. B. Neurofibromatosis type 1: review and update on emerging therapies. Asia Pac. J. Ophthalmol.8, 62–72 (2019). - PubMed
    1. Stewart, D. R., Korf, B. R., Nathanson, K. L., Stevenson, D. A. & Yohay, K. Care of adults with neurofibromatosis type 1: a clinical practice resource of the American College of Medical Genetics and Genomics (ACMG). Genet. Med.20, 671–682 (2018). - PubMed
    1. Evans, D. G. et al. Birth incidence and prevalence of tumor-prone syndromes: estimates from a UK family genetic register service. Am. J. Med. Genet. A152A, 327–332 (2010). - PubMed

LinkOut - more resources