. 2025 Apr 1;16(1):3111.
doi: 10.1038/s41467-025-58467-1.

Exercise-induced anti-obesity effects in male mice generated by a FOXO1-KLF10 reinforcing loop promoting adipose lipolysis

Affiliations

Exercise-induced anti-obesity effects in male mice generated by a FOXO1-KLF10 reinforcing loop promoting adipose lipolysis

Jie-Ying Zhu et al. Nat Commun. .

Abstract

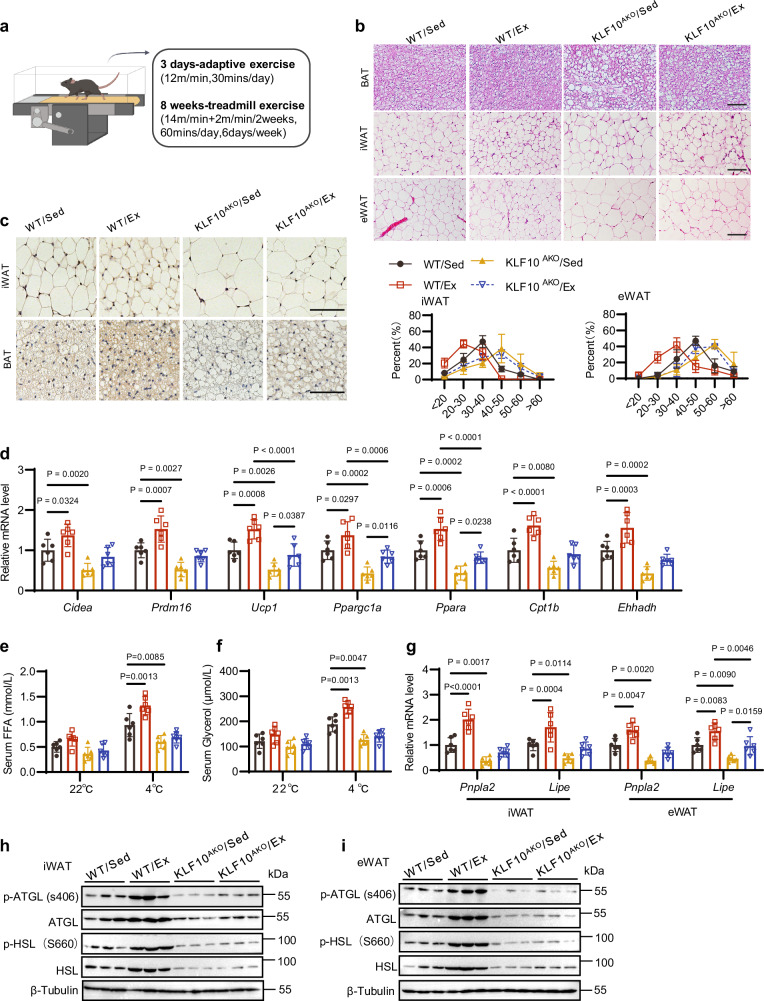
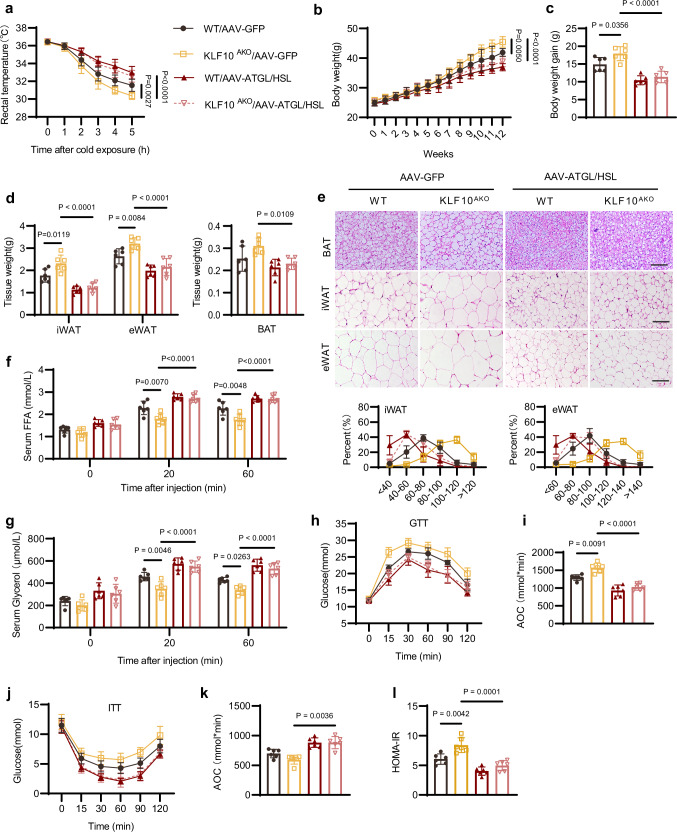
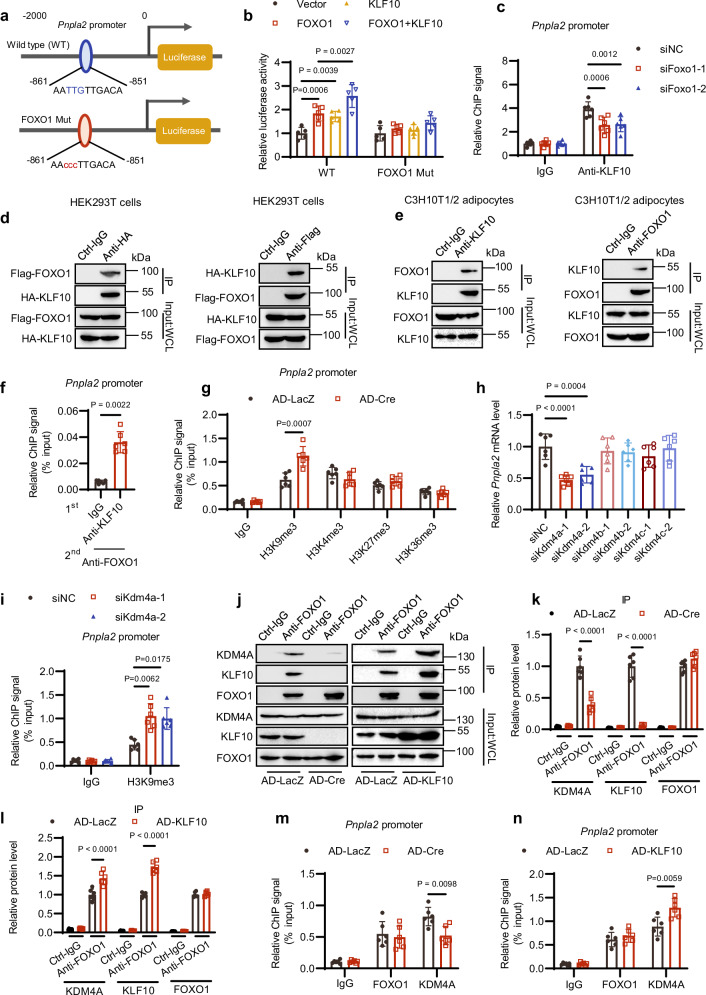
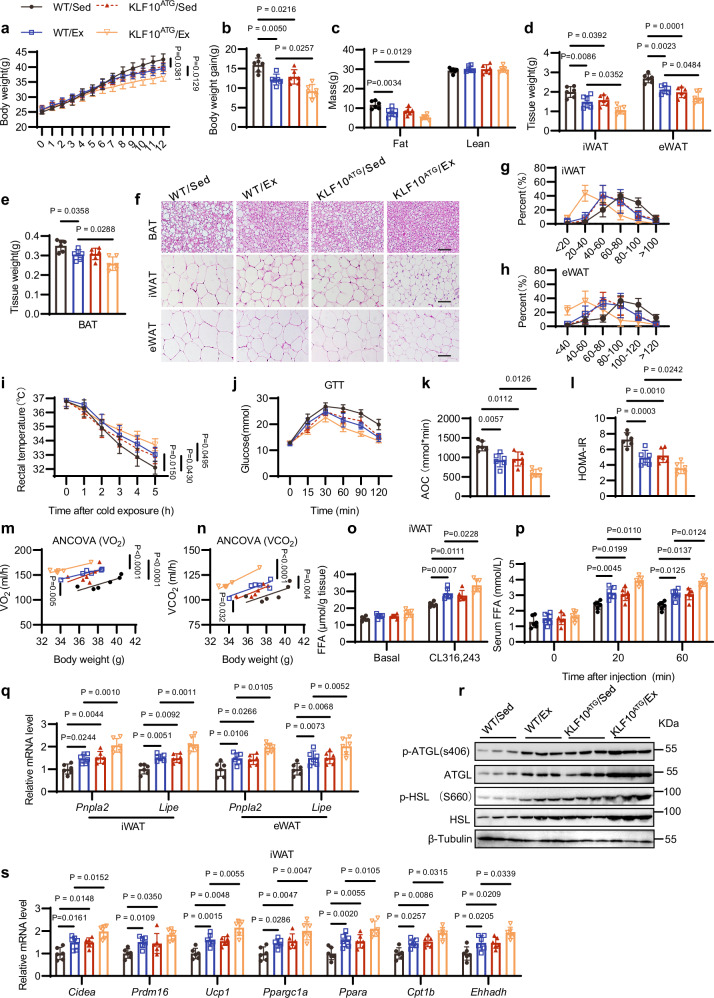
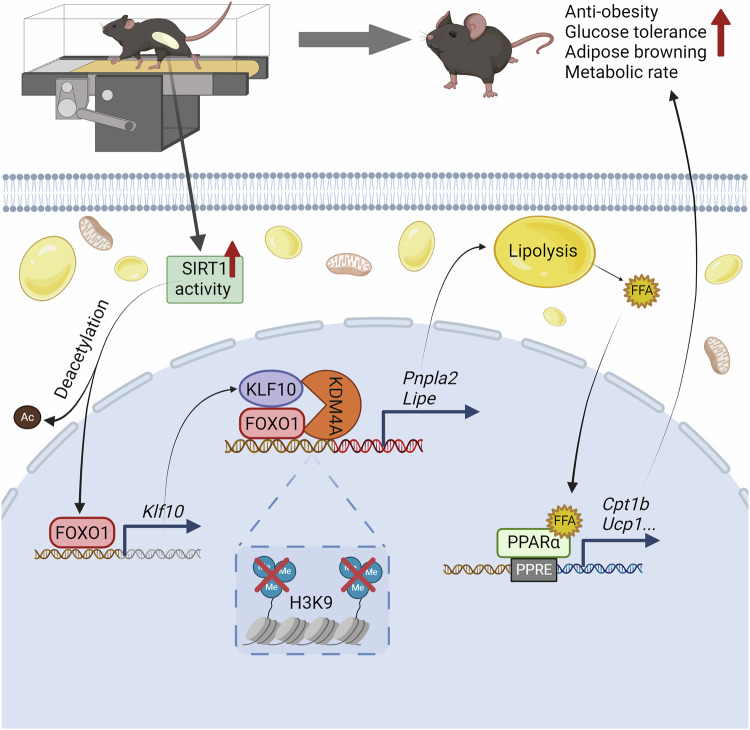
Exercise combats obesity and metabolic disorders, but the underlying mechanism is incompletely understood. KLF10, a transcription factor involved in various biological processes, has an undefined role in adipose tissue and obesity. Here, we show that exercise facilitates adipocyte-derived KLF10 expression via SIRT1/FOXO1 pathway. Adipocyte-specific knockout of KLF10 blunts exercise-promoted white adipose browning, energy expenditure, fat loss, glucose tolerance in diet-induced obese male mice. Conversely, adipocyte-specific transgenic expression of KLF10 in male mice enhanced the above metabolic profits induced by exercise. Mechanistically, KLF10 interacts with FOXO1 and facilitates the recruitment of KDM4A to form a ternary complex on the promoter regions of Pnpla2 and Lipe genes to promote these key lipolytic genes expression by demethylating H3K9me3 on their promoters, which facilitates lipolysis to defend against obesity in male mice. As a downstream effector responding to exercise, adipose KLF10 could act as a potential target in the fight against obesity.


Conflict of interest statement

Competing interests: The authors declare no competing interests.

Figures

Fig. 1
Fig. 1. KLF10 is upregulated in mature adipocytes in response to exercise and fasting.
From ah Chow diet-fed 8-week-old male mice were subjected to treadmill training for 8 weeks before being sacrificed for analysis. Sed, non-exercise. Ex, exercise. a, b Messenger RNA (mRNA) levels of Klf10 in stromal vascular fraction (SVF) and mature adipocytes of inguinal white adipose tissue (iWAT), respectively. c Representative western blotting of iWAT-isolated mature adipocytes lysates. β-tubulin serves as an internal control. d, e The mRNA levels of Klf10 in SVF and mature adipocytes of epididymal white adipose tissue (eWAT), respectively. f Representative western blotting of eWAT-isolated mature adipocytes lysates. g, h The mRNA levels of Klf10 in SVF and mature adipocytes of brown adipose tissue (BAT), respectively. i–n Chow diet-fed 8-week-old male mice were fasted for 12 h before being sacrificed for analysis. i, j The mRNA levels of Klf10 in SVF and mature adipocytes of iWAT, respectively. k, l The mRNA levels of Klf10 in SVF and mature adipocytes of eWAT, respectively. m, n, The mRNA levels of Klf10 in SVF and mature adipocytes of BAT, respectively. For statistical analysis, unpaired two-tailed Student’s t tests were performed. n = 6 male mice per group in all the above experiments. All data show the means ± SD. Source data are provided as a Source Data file.
Fig. 2
Fig. 2. SIRT1/FOXO1 axis mediates the induction of adipose KLF10 during exercise.
a Schematic representation of Klf10 proximal promoter constructs used for luciferase assays. Predicted consensus of FOXO1-binding site is shown in the wild type (WT) luciferase construct. The red letters indicate mutations of the FOXO1-binding site in the FOXO1-Mut construct. b, c Luciferase activities were measured in HEK293T cells. Data were normalized to the vector group (n = 5 independent biological replicates). dh Chow diet-fed 8-week-old male mice were treated as in Fig. 1a before being sacrificed for analysis. d, e FOXO1 enrichment on promoter of the indicated gene in iWAT and eWAT, respectively (n = 6 male mice/group). f FOXO1 acetylation was examined in iWAT and eWAT. Representative western blotting was shown. g, h SIRT1 activity in iWAT and eWAT, respectively (n = 6 mice/group). i Differentiated 3T3-L1 adipocytes were treated with or without SIRT1 antagonist Ex527 for 24 h (50 μM). Then Klf10 mRNA in the cells were determined (n = 6 independent biological replicates). jl Differentiated 3T3-L1 adipocytes were treated with or without SIRT1 agonist Srt1720 for 24 h (2 μM). Then Klf10 mRNA levels, KLF10 protein levels and FOXO1 acetylation levels in the cells were determined, respectively (n = 6 independent biological replicates). m Differentiated 3T3-L1 adipocytes were treated with or without Ex527 or Srt1720 for 24 h. Then FOXO1 enrichment on promoter of the indicated gene in the cells were determined (n = 6 independent biological replicates). n Differentiated 3T3-L1 adipocytes were transfected with the siRNA against FOXO1, with siNC as the control. After 36 h, the Foxo1 mRNA levels in the cells were determined (n = 6 independent biological replicates). o Differentiated 3T3-L1 adipocytes with or without the knockdown of FOXO1 were cultured in the presence or absence of Srt1720 for 24 h. Then Klf10 mRNA in the cells were determined (n = 6 independent biological replicates). For statistical analysis, one-way ANOVA plus Tukey’s post hoc tests were performed in b, n; two-way ANOVA plus Tukey’s post hoc tests were performed in ce, m, o; unpaired two-tailed Student’s t tests were performed in gj. All data show the means ± SD. Source data are provided as a Source Data file.
Fig. 3
Fig. 3. Adipocyte-specific knockout of KLF10 (KLF10AKO) impairs exercise-induced browning and lipid catabolism in male mice.
Chow diet (CD) fed KLF10AKO and wild type (WT) control male mice were subjected to treadmill training (Ex) or kept sedentary lifestyle (Sed) for 8 weeks before being sacrificed for analysis. a The treadmill exercise program is illustrated. The graph model was created in BioRender. Zhu, J. (2025) https://BioRender.com/z12f220. b Representative images of hematoxylin and eosin (H&E) staining of adipose tissues. Scale bars, 100 μm. Quantification of adipocyte diameter in iWAT and eWAT was shown below. c Immunohistochemistry (IHC) staining of UCP1 in iWAT and BAT. Scale bars, 50 μm. d The mRNA levels of the indicated genes in iWAT. Data were normalized to the WT/Sed group. e, f After 7 weeks of exercise training, the serum free fatty acid (FFA) and glycerol levels of CD-fed mice under 22 °C or 4 °C condition for 12 h. g The mRNA levels of the indicated genes in iWAT and eWAT. Data were normalized to the WT/Sed group. h, i Representative western blotting of iWAT and eWAT lysates. β-tubulin serves as an internal control. For statistical analysis, two-way ANOVA plus Tukey’s post hoc tests were performed in b, d, g; three-way ANOVA plus Tukey’s post hoc tests were performed in e, f. n = 6 male mice per group in all the above experiments. All data show the means ± SD. Source data are provided as a Source Data file.
Fig. 4
Fig. 4. KLF10AKO attenuates the effects of exercise on resisting diet-induced obesity (DIO) and metabolic disorders in male mice.
The 12-week high-fat diet (HFD)-fed KLF10AKO and WT control male mice were subjected to treadmill training (Ex) or kept sedentary lifestyle (Sed) in the last 10 weeks of HFD feeding before being sacrificed for analysis. ae Body weight, body weight gain, body composition and adipose tissue weight of the mice, respectively. f Representative images of hematoxylin and eosin (H&E) staining of adipose tissues. Scale bars, 100 μm. g Cold tolerance test was performed at the 10th week of HFD feeding. After 10 h of fasting, mice were subjected to cold exposure (4 °C) in the fasted state for 5 h, and the rectal temperatures of the mice were measured. hj Fasting blood glucose, fasting plasma insulin and HOMA-IR of the mice, respectively. k The glucose tolerance test (GTT) were performed in mice after 11 weeks of HFD feeding. l Analysis of the GTT data in m, with subtraction of the basal glucose to generate an area of the curve (AOC). m The oxygen consumption rate of iWAT of mice were measured. n, o Regression-based analysis of absolute VO2 and VCO2 against body weight of mice, respectively. p The mRNA levels of indicated genes in iWAT of mice. Data normalized to the WT/Sed group. For statistical analysis, two-way ANOVA plus Tukey’s post hoc tests were performed in ae, gj, l, m, p; two-sided analysis of covariance (ANCOVA) was performed in n, o. n = 6 male mice per group in all the above experiments. All data show the means ± SD. Source data are provided as a Source Data file.
Fig. 5
Fig. 5. KLF10 in mature adipocytes facilitates lipolysis.
a Heatmaps representing 2907 upregulated and 1639 downregulated genes (KLF10AKO vs WT) in the iWAT of HFD-fed mice without exercise which was obtained from the RNA sequencing (RNA-seq) data (Padj < 0.05). b Kyoto Encyclopedia of Genes and Genomes (KEGG) pathway analysis of downregulated genes based on RNA-seq data in a (Padj < 0.05). c The downregulated genes in lipolysis pathways based on the RNA-seq data (Padj < 0.05). d, e Mice were treated as described in Fig. 4. FFA release from iWAT and eWAT of mice under basal or CL316,243 (2 μM) stimulated conditions. f The mRNA levels of lipolysis-related genes in iWAT and eWAT of mice. g Representative western blotting of iWAT lysates. hk Differentiated primary adipocytes containing KLF10flox/flox loci in the genome were infected with adenoviruses (AD) harboring LacZ (AD-LacZ) or Cre (AD-Cre). h, i FFA and glycerol release from the adipocytes under basal or isoproterenol (ISO, 2 μM) stimulated conditions. j The mRNA levels of indicated genes in primary adipocytes. k Representative western blotting of primary adipocytes lysates. l–n Differentiated primary adipocytes were infected with adenoviruses (AD) harboring LacZ (AD-LacZ) or KLF10 (AD-KLF10). l, m FFA and glycerol release from the adipocytes under basal or isoproterenol (ISO, 2 μM) stimulated conditions. n The mRNA levels of indicated genes in differentiated primary adipocytes. Data normalized to the AD-LacZ group. o The mRNA levels of indicated genes in differentiated primary adipocytes infected with AD-LacZ or AD-KLF10, which were then treated with GW6471 (10 μM) or vehicle for 24 h. Data normalized to the AD-LacZ+Vehicle group. n = 4 mice per group in a, c, n = 6 mice per group in df, n = 6 independent biological replicates in hj, lo. For statistical analysis, two-sided Wald tests plus Benjamini-Hochberg procedure were performed in ac, three-way ANOVA plus Tukey’s post hoc tests were performed in d, e; two-way ANOVA plus Tukey’s post hoc tests were performed in f, h, i, l, m, o; unpaired two-tailed Student’s t tests were performed in n; two-tailed Wilcoxon test was performed in j. All data show the means ± SD. Source data are provided as a Source Data file.
Fig. 6
Fig. 6. KLF10AKO impairs lipolysis to exacerbate diet-induced obesity (DIO) and metabolic disorders in male mice.
KLF10AKO and WT control male mice were subjected to injection of adeno-associated viral (AAV) vectors harboring the genes encoding ATGL (AAV-ATGL), HSL(AAV-HSL) or GFP (AAV-GFP, as the control) in iWATs and eWATs. One week later, mice were fed with high-fat diet (HFD) for 12 weeks before being sacrificed. a Cold tolerance test was performed at the 10th week of HFD feeding. After 10 h of fasting, mice were subjected to cold exposure (4 °C) in the fasted state for 5 h, and the rectal temperatures of the mice were measured. bd, Body weight, body weight gain and adipose tissue weight of the mice, respectively. e Representative images of hematoxylin and eosin (H&E) staining of mice adipose tissues. Scale bars, 100 μm. Quantification of adipocyte diameter in iWAT and eWAT was shown below. f, g The serum FFA and glycerol levels of 10-week HFD-fed mice under basal or Cl316,243 stimulated condition (injection with 1 mg/kg body weight). h GTT was performed in mice after 11 weeks of HFD feeding. i Analysis of the GTT data in h, with subtraction of the basal glucose to generate an area of the curve (AOC). j ITT was performed in mice after 11 weeks of HFD feeding. k Analysis of the GTT data in j, with subtraction of the basal glucose to generate an area of the curve (AOC). l HOMA-IR of mice after 12 weeks of HFD feeding. For statistical analysis, two-way ANOVA plus Tukey’s post hoc tests were performed in ae, i, l; three-way ANOVA plus Tukey’s post hoc tests were performed in f, g; Kruskal–Wallis test with Dunn’s correction was performed in k. n = 6 male mice per group in all the above experiments. All data show the means ± SD. Source data are provided as a Source Data file.
Fig. 7
Fig. 7. KLF10 forms a complex with FOXO1 and KDM4A to promote the transactivation of ATGL.
a Schematic representation of Pnpla2 proximal promoter constructs used for luciferase assays. The predicted consensus of FOXO1-binding site is shown in the WT luciferase construct. The red letters indicate mutations of the FOXO1-binding site in the FOXO1-Mut construct. b Luciferase activities were measured in HEK293T cells (n = 5 independent biological replicates). Data were normalized to the Vector group. c Differentiated C3H10T1/2 adipocytes were transfected with the indicated siRNAs. Then KLF10 enrichment on the promoter of Pnpla2 gene was determined. Data were normalized to the corresponding IgG control group. d, e Representative immunoblot of exogenous co-immunoprecipitation (Co-IP) in HEK293T cells and endogenous Co-IP in C3H10T1/2 adipocytes. WCL, whole cell lysates. f Enrichment of KLF10-interacting FOXO1 on promoter of the indicated gene by using the Re-ChIP method. g Enrichment of H3K9me3, H3K4me3, H3K27me3, H3K36me3 on promoter of the indicated gene in KLF10 knockout mice primary adipocytes. h C3H10T1/2 adipocytes were transfected with the indicated siRNAs and the mRNA level of Pnpla2 in the cells were examined. Data were normalized to the siNC group. i H3K9me3 enrichment on promoter of the indicated gene in C3H10T1/2 adipocytes. j Representative immunoblot of endogenous Co-IP in differentiated mice primary adipocytes with KLF10 knockout (AD-Cre) or overexpression (AD-KLF10). k, l Quantification of immunoblot results in j. Data were normalized to the AD-LacZ/Anti-FOXO1 group. m, n Differentiated primary adipocytes were infected with adenoviruses (AD) harboring the indicated genes. Then FOXO1 and KDM4A enrichment on promoter of the indicated gene in the cells was examined. n = 6 independent biological replicates in cn. For statistical analysis, two-way ANOVA plus Tukey’s post hoc tests were performed in b, c, g, i, kn; two-tailed Wilcoxon test was performed in f; one-way ANOVA plus Tukey’s post hoc tests were performed in h. All data show the means ± SD. Source data are provided as a Source Data file.
Fig. 8
Fig. 8. Adipose-specific KLF10 transgenic (KLF10ATG) promotes exercise-mediated alleviation of DIO and metabolic dysfunction in male mice.
The 12-week high-fat diet (HFD)-fed KLF10ATG and WT control male mice were subjected to treadmill training or kept sedentary lifestyle in the last 10 weeks of HFD feeding before being sacrificed for analysis. ae Body weight, body weight gain, body composition and adipose tissue weight of the mice. f Representative images of hematoxylin and eosin (H&E) staining of adipose tissues. Scale bars, 100 μm. g, h Quantification of adipocyte diameter in iWAT and eWAT based on the results of f. i Cold tolerance test was performed at the 10th week of HFD feeding. After 10 h of fasting, mice were subjected to cold exposure (4 °C) in the fasted state for 5 h, and the rectal temperatures of the mice were measured. j GTT were performed in mice after 11 weeks of HFD feeding. k Analysis of the GTT data in j, with subtraction of the basal glucose to generate an area of the curve (AOC). l HOMA-IR of the mice. m, n Regression-based analysis of absolute VO2 and VCO2 against body weight of mice. o FFA release in iWAT isolated from mice under basal or CL316,243 (2 μM) stimulated conditions. p The serum FFA level of HFD-fed mice under basal or Cl316,243 stimulated condition (injection with 1 mg/kg body weight). q The mRNA levels of indicate genes in iWAT and eWAT of mice. Data normalized to the WT/Sed group. r Representative western blotting of iWAT lysates. s The mRNA levels of indicate genes in iWAT of mice. Data normalized to the WT/Sed group. For statistical analysis, two-way ANOVA plus Tukey’s post hoc tests were performed in ae, gi, k, l, q, s; two-sided analysis of covariance (ANCOVA) was performed in m, n; three-way ANOVA plus Tukey’s post hoc tests were performed in o, p. n = 6 male mice per group in all the above experiments. All data show the means ± SD. Source data are provided as a Source Data file.
Fig. 9
Fig. 9. A graph model for the role of adipose KLF10 in exercise-induced anti-obesity and metabolic improvement effects.
KLF10 in mature adipocytes is upregulated by SIRT1/FOXO1 axis in response to exercise and then interacts with FOXO1 to recruit histone lysine demethylase 4A (KDM4A) and form a ternary complex, thereby strengthening the transcription of key lipolytic genes (Pnpla2 and Lipe) to promote lipolysis. Free fatty acids (FFAs), the products of lipolysis, could act as a ligand of PPARα to activate it. And then PPARα increases the expression of fatty acid oxidation (FAO) genes (such as Cpt1b) and browning genes (such as Ucp1) to fuel adipose catabolism. The above FOXO1-KLF10 reinforcing loop contributes to exercise-mediated anti-obesity and metabolic improvement effects in mice. The graph model was created in BioRender. Zhu, J. (2023) BioRender.com/e08n146.

References

    1. Xia, W. et al. Obesity causes mitochondrial fragmentation and dysfunction in white adipocytes due to RalA activation. Nat. Metab.6, 273–289 (2024). - PMC - PubMed
    1. Kulaj, K. et al. Adipocyte-derived extracellular vesicles increase insulin secretion through transport of insulinotropic protein cargo. Nat. Commun.14, 709 (2023). - PMC - PubMed
    1. Sakers, A., De Siqueira, M. K., Seale, P. & Villanueva, C. J. Adipose-tissue plasticity in health and disease. Cell185, 419–446 (2022). - PMC - PubMed
    1. Li, B. Y., Guo, Y. Y., Xiao, G., Guo, L. & Tang, Q. Q. SERPINA3C ameliorates adipose tissue inflammation through the Cathepsin G/Integrin/AKT pathway. Mol. Metab.61, 101500 (2022). - PMC - PubMed
    1. Lund, J. et al. The anorectic and thermogenic effects of pharmacological lactate in male mice are confounded by treatment osmolarity and co-administered counterions. Nat. Metab.5, 677–698 (2023). - PubMed

MeSH terms