. 2025 Apr 1;16(1):3125.
doi: 10.1038/s41467-025-58360-x.

Kupffer cell and recruited macrophage heterogeneity orchestrate granuloma maturation and hepatic immunity in visceral leishmaniasis

Affiliations

Kupffer cell and recruited macrophage heterogeneity orchestrate granuloma maturation and hepatic immunity in visceral leishmaniasis

Gabriela Pessenda et al. Nat Commun. .

Abstract

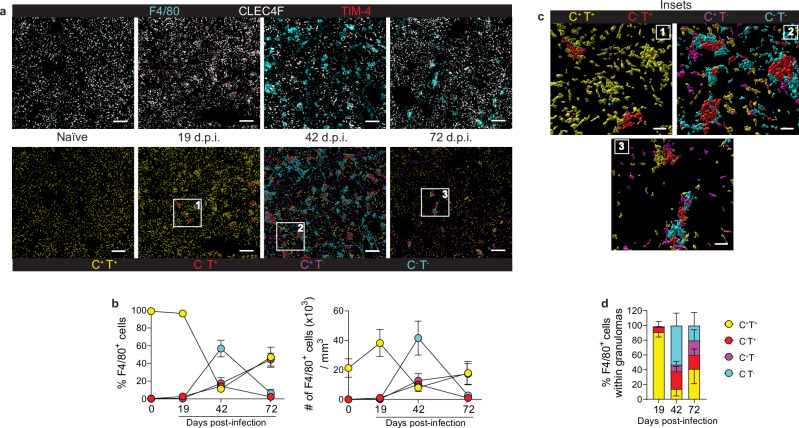
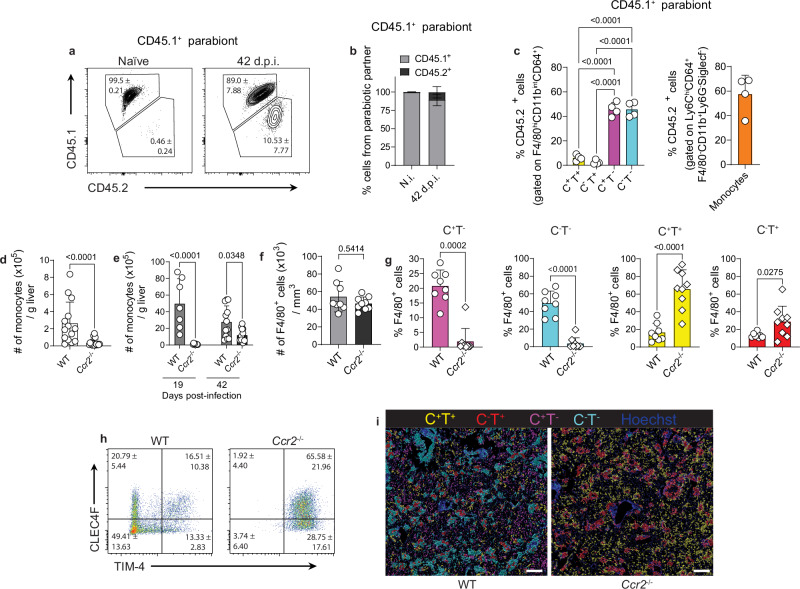
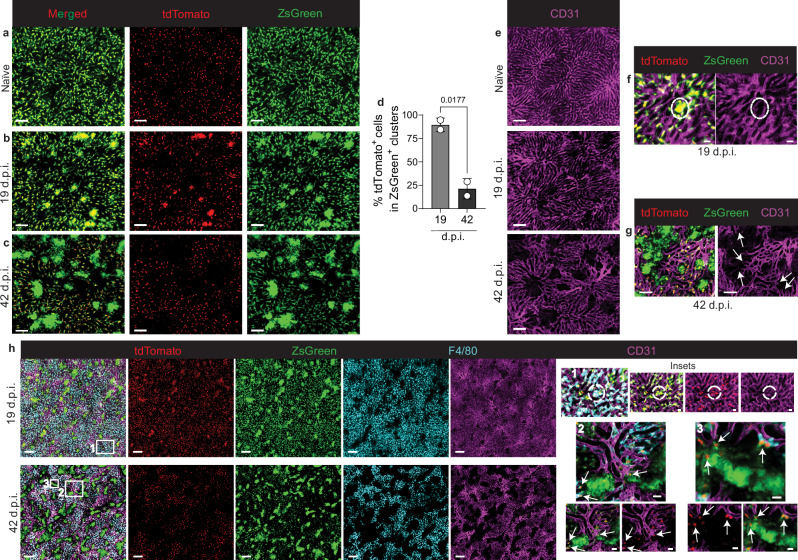
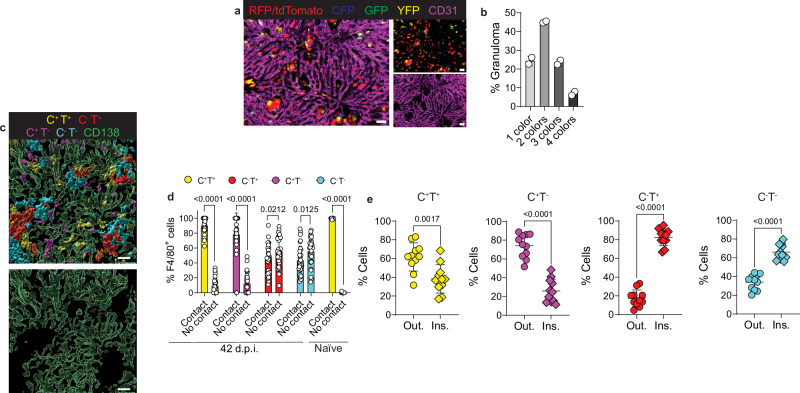
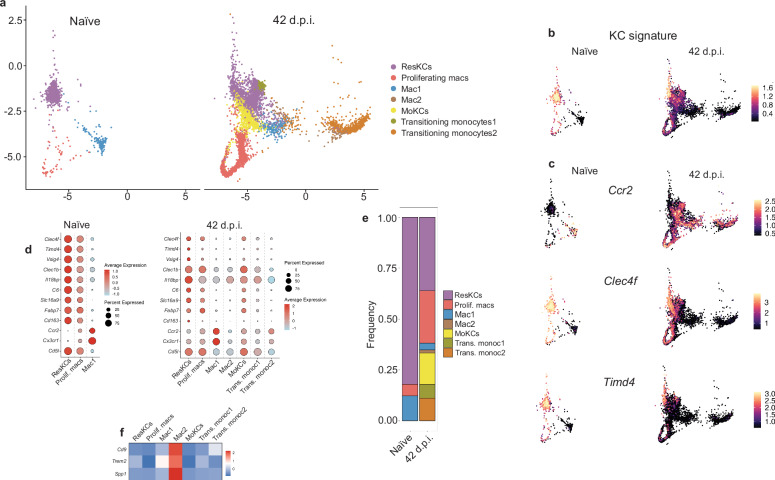
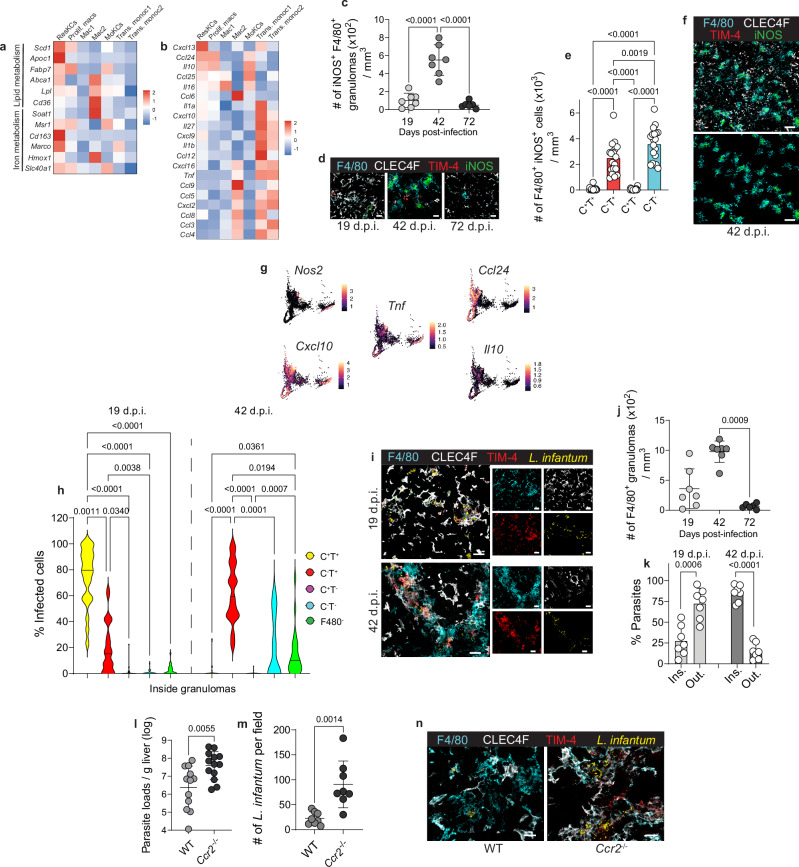
In murine models of visceral leishmaniasis (VL), the parasitization of resident Kupffer cells (resKCs) drives early Leishmania infantum growth in the liver, leading to granuloma formation and subsequent parasite control. Using the chronic VL model, we demonstrate that polyclonal resKCs redistributed to form granulomas outside the sinusoids, creating an open sinusoidal niche that was gradually repopulated by monocyte-derived KCs (moKCs) acquiring a tissue specific, homeostatic profile. Early-stage granulomas predominantly consisted of CLEC4F+KCs. In contrast, late-stage granulomas led to remodeling of the sinusoidal network and contained monocyte-derived macrophages (momacs) along with KCs that downregulated CLEC4F, with both populations expressing iNOS and pro-inflammatory chemokines. During late-stage infection, parasites were largely confined to CLEC4F-KCs. Reduced monocyte recruitment and increased resKCs proliferation in infected Ccr2-/- mice impaired parasite control. These findings show that the ontogenic heterogeneity of granuloma macrophages is closely linked to granuloma maturation and the development of hepatic immunity in VL.


Conflict of interest statement

Competing interests: The authors declare no competing interests.

Figures

Fig. 1
Fig. 1. CLEC4F and TIM-4 serve as markers for identifying macrophage heterogeneity in VL.
a Top: Representative confocal microscopy images showing wild-type naïve, 19-, 42-, and 72-day infected livers stained with anti-F4/80 (cyan), anti-CLEC4F (white), and anti-TIM-4 (red). Bottom: Surface rendered F4/80+ cells classified according to their CLEC4F and TIM-4 expression, CLEC4F+TIM-4+ (yellow), CLEC4F-TIM-4+ (red), CLEC4F+TIM-4- (magenta), and CLEC4F-TIM-4- (cyan). Scale bars, 200 μm. b Frequency and number of F4/80+ cells classified according to their CLEC4F and TIM-4 expression, in naïve and infected mice at different days post-infection. Data pooled from 2 independent experiments (n = 6 for naïve and n = 7 for infected mice). c Granulomas identified in (a) are shown in the inset and were defined as clusters of F4/80+ cells with volumes greater than 1.03 × 104 μm3. Scale bars, 40 μm. d Proportion of CLEC4F+ and/or TIM-4+ cells in F4/80+ granulomas at different times post-infection. Data pooled from 2 (19- and 72 d.p.i.) and 4 (42 d.p.i.) independent experiments (n = 7 for 19- and 72 d.p.i. and n = 15 for 42 d.p.i.). Values in (b and d) represent the mean ± SD. Source data are provided as a Source Data file.
Fig. 2
Fig. 2. TIM-4- macrophages are monocyte-derived during late-stage VL.
a Representative contour plots showing the percentages of chimerism in F4/80+CD11bintCD64+ cells from naïve and 42-day infected CD45.1+ parabiont. b Percentages of chimerism in F4/80+CD11bintCD64+ cells from uninfected and infected CD45.1+ parabiotic partners at 42 d.p.i. c Frequency of CD45.2+ cells in infected CD45.1+ parabionts, gated on F4/80+CD11bintCD64+CLEC4F+/-TIM-4+/- macrophages or Ly6C+CD11b+Ly6G-SiglecF- monocytes. Data pooled from two independent experiments (n = 3 for uninfected and n = 4 for infected pairs). d, e Number of monocytes in the livers of naïve (d) and 19- and 42-day infected WT and Ccr2−/− mice (e) determined by flow cytometry. Data pooled from 5 independent experiments (naïve, n = 14 for WT and n = 17 for Ccr2−/−; 19 d.p.i., n = 7 for WT and n = 9 for Ccr2−/−; 42 d.p.i., n = 12 for WT and n = 14 for Ccr2−/−). f Number of F4/80+ cells in WT and Ccr2−/− at 42 d.p.i., quantified from confocal microscopy images. g Frequency of macrophage subsets based on CLEC4F and TIM-4 expression in WT and Ccr2−/− mice at 42 d.p.i., quantified from confocal microscopy images. Data pooled from 2 independent experiments (n = 8 for WT and n = 9 for Ccr2−/−). In (bg) values show mean ± SD. In (d, f ) for data that passed the normality test, P values were obtained using a two-tailed unpaired t test. For data that did not pass the normality test, P values were obtained using a two-tailed Mann-Whitney test. In (c) P-values were obtained using ordinary one-way ANOVA with Tukey’s multiple comparisons, in (e) P-values were obtained using ordinary one-way ANOVA with Sidak’s multiple comparisons. h Representative dot plots from confocal microscopy images showing the frequency of macrophage subsets in infected WT and Ccr2−/− mice at 42 d.p.i. Numbers indicate mean ± SD percentage of cells in the gate. i Representative rendered confocal microscopy images of 42 d.p.i. livers from WT and Ccr2−/− mice showing CLEC4F+TIM-4+ (yellow) and CLEC4F-TIM-4+ (red) macrophages, CLEC4F+TIM-4 (magenta) moKCs and CLEC4F-TIM-4- (cyan) momacs. Scale bars, 200μm. Source data are provided as a Source Data file.
Fig. 3
Fig. 3. Kupffer cells in late-stage granulomas are CLEC4F- and are located outside the sinusoids.
ac Representative live images from naïve (a), 19-day (b) and 42-day (c) infected Clec4fCre-TdTZsGreen mice, showing Clec4f active expression (red) and Clec4f previous expression (green). Scale bars, 100 μm. d Frequency of tdTomato+ cells identified in ZsGreen+ granulomas at 19 and 42 d.p.i. Data pooled from live imaging carried out in 4 independent experiments (n = 2 for 19 d.p.i. and n = 2 for 42 d.p.i.). Values represent mean ± SD. P-values were obtained using a two-tailed unpaired t test. e Sinusoid distribution from images (ac), visualized by CD31 staining (magenta). Scale bars, 100 μm. f Representative images showing a tdTomato+ZsGreen+ cluster (red and green) and the sinusoids (magenta) at 19 d.p.i. Scale bars, 20 μm. g Representative images showing tdTomato-ZsGreen+ clusters (green) and the sinusoids (magenta) at 42 d.p.i. Scale bars, 50 μm. h Images of Clec4fCre-TdTZsGreen mice at 19 and 42 d.p.i., showing Clec4f active expression (red), Clec4f previous expression (green), F4/80 (cyan), and sinusoids (magenta). Scale bars, 200 μm. Inset 1, the dotted line indicates a small cluster of F4/80+tdTomato+ZsGreen+KCs in contact with intact sinusoids. Scale bars, 20 μm. Insets 2 and 3 show tdTomato-ZsGreen+ clusters outside the sinusoids. Arrows point to tdTomato+ZsGreen+ F4/80+ or F4/80 KCs within granulomas, next to or in contact with the sinusoids. Scale bars, 15 μm. Source data are provided as a Source Data file.
Fig. 4
Fig. 4. Clonality and spatial distribution of macrophage subsets during late-stage VL.
a Intravital microscopy images representing a 42-day infected liver from a Clec4fCre-TdTConfetti mouse, stained with anti-CD31 (magenta), and showing tdTomato (red-nucleus), RFP (red-cytoplasm), YFP (yellow-cytoplasm), GFP (green-nucleus), and CFP (blue-membrane) KCs. Scale bars, 50 μm. b Frequency of KC clones in granulomas based on KC colors. Data pooled from live imaging performed in 2 independent experiments (n = 2 and quantification of 284 granulomas). c Representative rendered immunofluorescence image of a 42-day infected, wild-type liver showing the spatial distribution of CLEC4F+TIM-4+resKCs (yellow), CLEC4F-TIM-4+KCs (red), CLEC4F+TIM-4- moKCs (magenta), CLEC4F-TIM-4-momacs (cyan), and sinusoids (green). Scale bars, 30 μm. d Bar graphs showing the localization of each macrophage subset according to their interaction with the sinusoids in 42-day infected and naïve, wild-type mice. Data pooled from 2 independent experiments using 4 naïve mice and 8 infected mice (42 d.p.i.). Frequencies were calculated from four regions of interest (ROIs) per infected mouse (n = 32 ROIs) and 2-3 ROIs per uninfected mouse (n = 11 ROIs). e Scatter plots from immunofluorescence images showing the frequency of each F4/80+ population based on their distribution outside or inside granulomas at 42 d.p.i. Data pooled from 3 independent experiments (n = 11). In (d, e) for data that passed the normality test, P-values were obtained using a two-tailed unpaired t test. For data that did not pass the normality test, P-values were obtained using a two-tailed Mann-Whitney test. Values from (b, d, e) represent mean ± SD. Source data are provided as a Source Data file.
Fig. 5
Fig. 5. VL-induced macrophage heterogeneity revealed by single-cell RNA sequencing.
a UMAP plot of scRNA-seq data from sorted live, single, CD45.2+F4/80+CD11bintCD64+ cells from livers of uninfected and 42 d.p.i. mice, showing three main clusters for naïve and seven clusters for infected mice. b Annotated UMAP plot showing the single-cell expression of conserved KC signature genes as described by Guilliams et al. c Single-cell expression of Ccr2, Clec4f, and Timd4 in CD45.2+F4/80+CD11bintCD64+ cells from naïve and 42 d.p.i. mice. d Average gene expression and the percentage of cells expressing each gene within the identified clusters in naïve and 42-day infected CD45.2+F4/80+CD11bintCD64+ cells. e Frequency of the different subsets identified by scRNA-seq in naïve and 42 d.p.i. mice. f Heatmap showing the differential expression of Mac2-specific genes identified by Remmerie et al.. Data include 1200 naïve cells and 6152 cells from 42 d.p.i. mice after QC filtering.
Fig. 6
Fig. 6. Functional heterogeneity of macrophage subsets and the contribution of monocyte-derived macrophages to L. infantum control.
a, b Relative expression of lipid and iron metabolism (a), and chemokines and cytokines (b) genes from sorted CD45.2+F4/80+CD11bintCD64+ cells at 42 d.p.i. Data was downsampled to a maximum of 500 cells per cluster. c Number of iNOS+F4/80+ granulomas in WT mice, quantified from immunofluorescence images. Data pooled from 2 independent experiments (n = 7 for 19- and 42 d.p.i. and n = 6 for 72 d.p.i.). d Representative images showing F4/80(cyan), CLEC4F(white), TIM-4(red), and iNOS(green) in WT livers. Scale bars, 30 μm. e Number of F4/80+iNOS+ macrophages in WT livers at 42 d.p.i. Data pooled from 5 independent experiments (n = 19). f Representative images showing F4/8(cyan), CLEC4F(white), TIM-4(red), and iNOS(green) (top), F4/80+iNOS+ granulomas (bottom) in WT liver at 42 d.p.i. Scale bars, 100 μm. g Single-cell expression of Nos2, chemokines, and cytokines in CD45.2+F4/80+CD11bintCD64+ cells at 42 d.p.i. h Frequency of infected cells within F4/80+ granulomas, obtained from 2-3 regions from each liver (ROIs=24 for 19 d.p.i., ROIs=23 for 42 d.p.i.). Data pooled from 2 independent experiments for each time point, 8 mice at 19- and 42 d.p.i., 7 mice at 72 d.p.i. i Representative images of F4/80+ macrophages in WT livers, stained with anti-F4/80(cyan), anti-CLEC4F(white), anti-TIM-4(red), and anti-L. infantum(yellow). Scale bars, 30 μm. j Number of F4/80+ granulomas quantified from immunofluorescence images. Data pooled from 2 independent experiments (n = 7 for 19- and 42 d.p.i., n = 6 for 72 d.p.i.). k Distribution of parasites inside and outside F4/80+ granulomas. Data pooled from 2 independent experiments (n = 7). l Parasite loads in WT and Ccr2-/- mice at 42 d.p.i. Data pooled from 3 independent experiments (n = 12 for WT and n = 13 for Ccr2−/−). m Number of L. infantum amastigotes per field in 42-day infected WT and Ccr2−/− mice, quantified from confocal microscopy images. Data pooled from 2 independent experiments (n = 8). n Representative images showing F4/80(cyan), CLEC4F(white), TIM-4(red), and L. infantum(yellow) in WT and Ccr2−/− livers at 42 d.p.i. Scale bars, 20 μm. Values in (c, e, h, jm) represent the mean ± SD. P values were obtained in (c, e) using ordinary one-way ANOVA with Tukey’s multiple comparisons test, in (h, j) using Kruskal-Wallis test with Dunn’s multiple comparisons tests, in (km) using a two-tailed unpaired t test. Source data are provided as a Source Data file.

Update of

Similar articles

Cited by

References

    1. Krenkel, O. & Tacke, F. Liver macrophages in tissue homeostasis and disease. Nat. Rev. Immunol.17, 306–321 (2017). - PubMed
    1. Guilliams, M. & Scott, C. L. Liver macrophages in health and disease. Immunity55, 1515–1529 (2022). - PubMed
    1. Sheng, J., Ruedl, C. & Karjalainen, K. Most tissue-resident macrophages except microglia are derived from fetal hematopoietic stem cells. Immunity43, 382–393 (2015). - PubMed
    1. Hoeffel, G. et al. C-Myb(+) erythro-myeloid progenitor-derived fetal monocytes give rise to adult tissue-resident macrophages. Immunity42, 665–678 (2015). - PMC - PubMed
    1. Gomez Perdiguero, E. et al. Tissue-resident macrophages originate from yolk-sac-derived erythro-myeloid progenitors. Nature518, 547–551 (2015). - PMC - PubMed

MeSH terms

LinkOut - more resources