. 2025 Apr 2;9(1):95.
doi: 10.1038/s41698-025-00883-z.

Uncovering gene and cellular signatures of immune checkpoint response via machine learning and single-cell RNA-seq

Affiliations

Uncovering gene and cellular signatures of immune checkpoint response via machine learning and single-cell RNA-seq

Asaf Pinhasi et al. NPJ Precis Oncol. .

Abstract

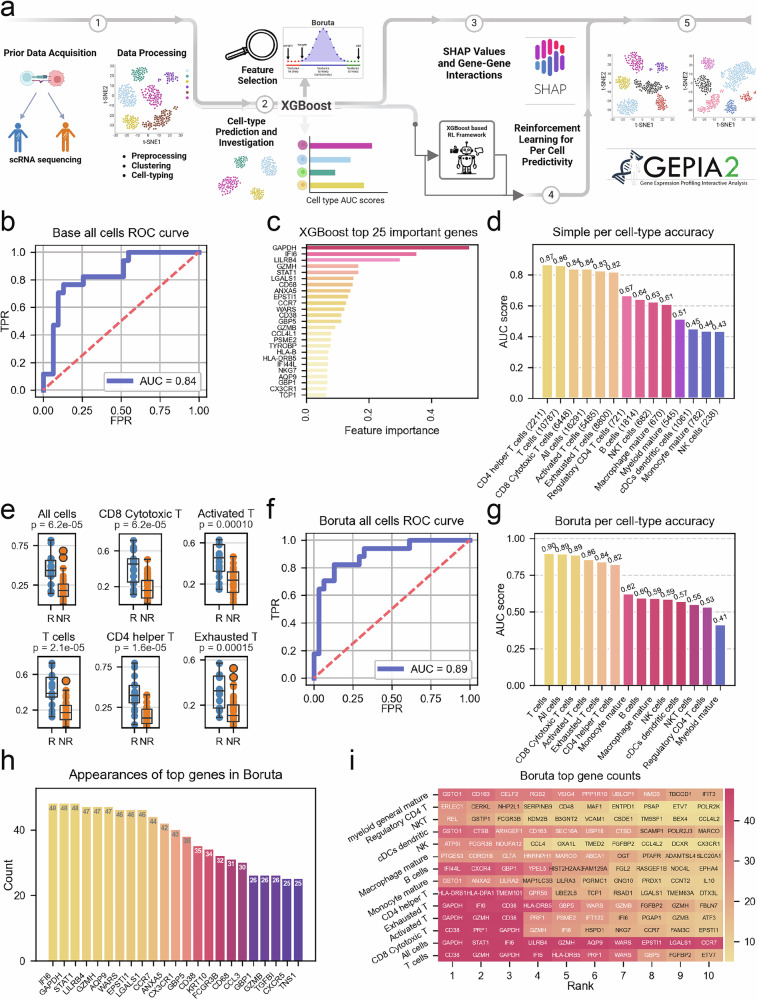
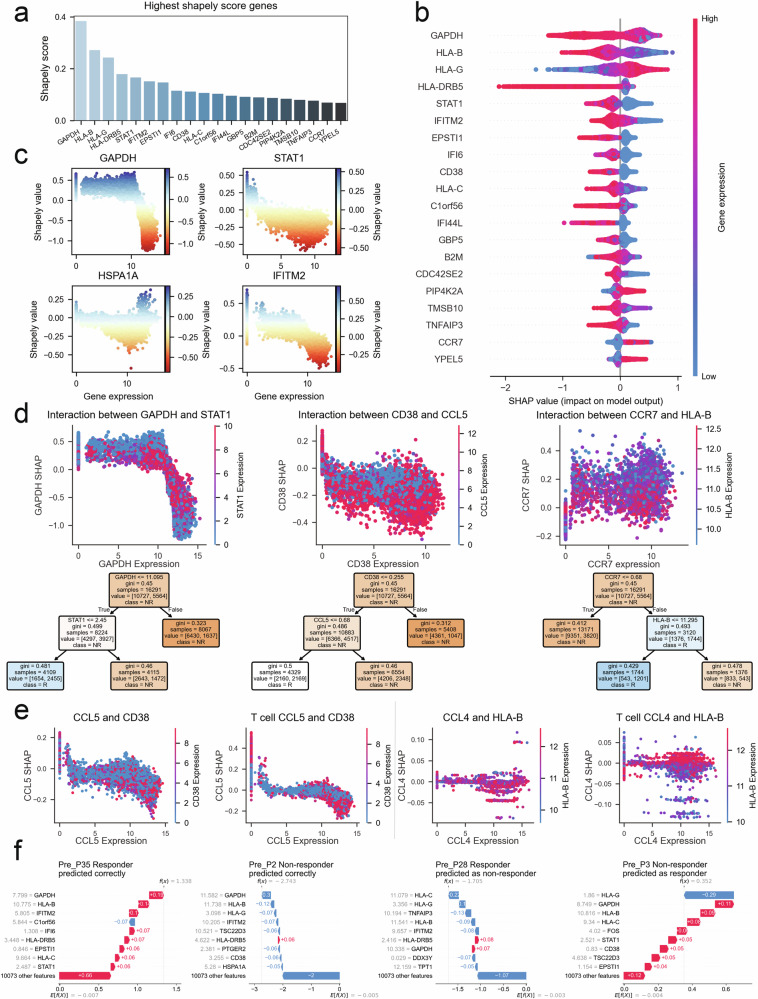
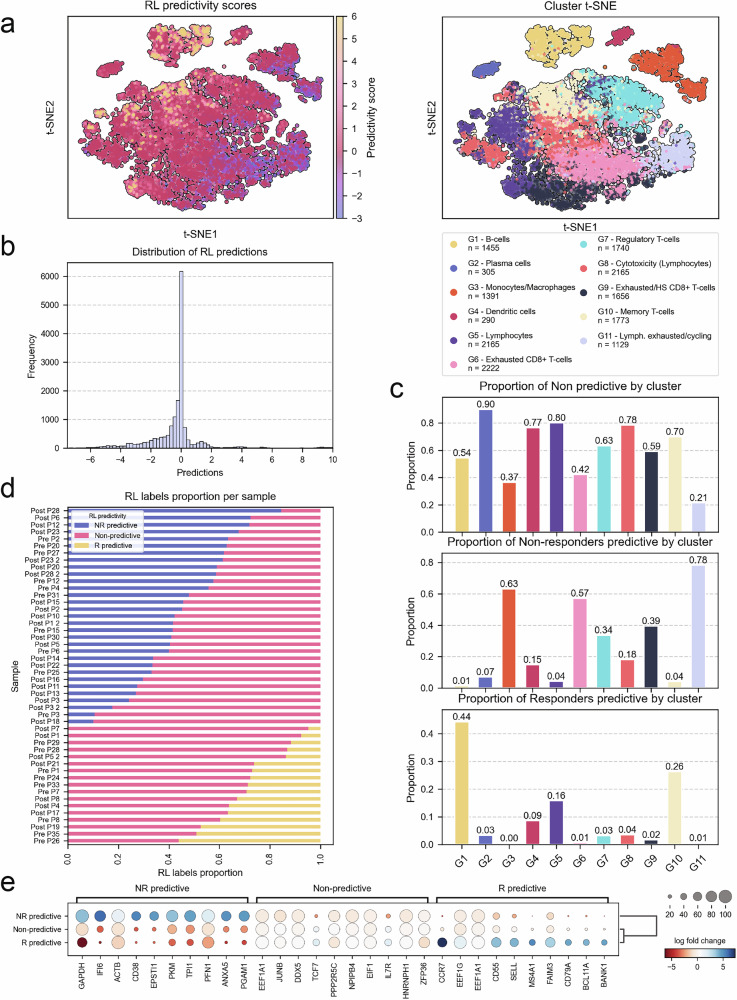
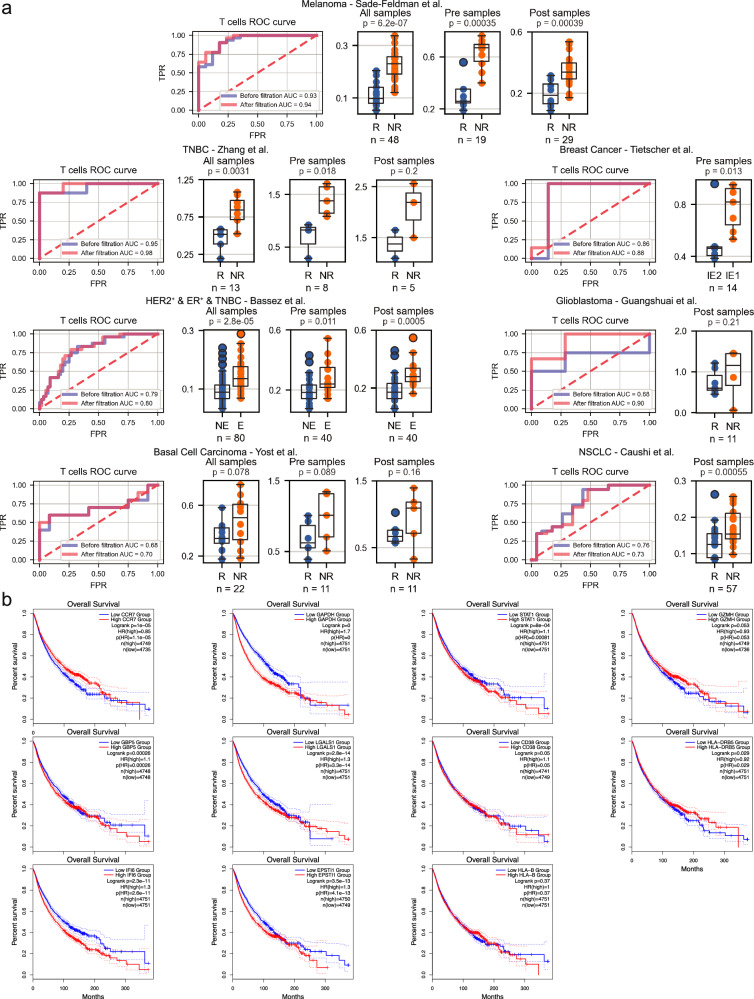
Immune checkpoint inhibitors have transformed cancer therapy. However, only a fraction of patients benefit from these treatments. The variability in patient responses remains a significant challenge due to the intricate nature of the tumor microenvironment. Here, we harness single-cell RNA-sequencing data and employ machine learning to predict patient responses while preserving interpretability and single-cell resolution. Using a dataset of melanoma-infiltrated immune cells, we applied XGBoost, achieving an initial AUC score of 0.84, which improved to 0.89 following Boruta feature selection. This analysis revealed an 11-gene signature predictive across various cancer types. SHAP value analysis of these genes uncovered diverse gene-pair interactions with non-linear and context-dependent effects. Finally, we developed a reinforcement learning model to identify the most informative single cells for predictivity. This approach highlights the power of advanced computational methods to deepen our understanding of cancer immunity and enhance the prediction of treatment outcomes.


Conflict of interest statement

Competing interests: The authors declare no competing interests.

Figures

Fig. 1
Fig. 1. Prediction of ICI response using XGBoost and Boruta feature selection per cell-type.
a Schematic workflow of the study: after preprocessing and quality control, the input data undergoes cell-type annotation to ensure a clean and well-annotated dataset (1). Each cell is then labeled according to its sample’s response status, and a classifier is trained at the single-cell level to differentiate responder cells from non-responder cells. The proportion of responder cells within a sample constitutes the sample score, serving as a prediction of likelihood to respond. This base model is then utilized in two main axes: (2 top, 3) interpretation of gene importance and behavior, using feature selection, feature importance analysis, and SHAP values; and (2 bottom, 4) analysis of cell importance, through cell-type prediction and a reinforcement learning framework for quantification of cell predictivity. (5) Finally, results from both axes are validated on independent datasets. b ROC curve for the base model predicting response to ICI using all cells and genes in the cohort. c XGBoost feature importance bar-plot showing the top 25 most important genes. d AUC scores indicating the prediction accuracy of the base model across different immune cell types. e Box plots comparing the scores produced by base XGBoost between responders (R) and non-responders (NR) across top most accurate cell subtypes, with significance values indicated by the Mann–Whitney U test. f ROC curve for the Boruta-selected model predicting response to ICI using all cells in the cohort. g AUC scores indicating the prediction accuracy of the Boruta-selected model across different immune cell types. h Bar-plot of the number of occurrences of each gene in the Boruta selection across the LOO folds, showing the top most robust genes. i Heatmap displaying the top genes selected by Boruta for different immune cell types, showing the number of occurrences of each gene for each cell type.
Fig. 2
Fig. 2. SHAP analysis of gene-gene interactions in immune response prediction.
a 20 Top genes with highest absolute Shapley score identified in the model. b SHAP value summary plot depicting the impact of each of the most important genes on model output. Gene expression (shown by coloring) as a function of SHAP value (x-axis) showing the relation between expression pattern and model’s prediction. c Scatter plots showing the relationship between gene expression and SHAP values for key genes (GAPDH, STAT1, IFITM2, and HSPA1A). d Interaction plots illustrating the SHAP value dependencies between specific gene pairs: GAPDH & STAT1 (left), CD38 & CCL5 (middle), CCR7 & HLA-B (right). Expression of the first gene shown as x-axis position, and the expression of the interacting gene shown as coloring; SHAP value shown as y-axis position. Decision trees beneath the plots show the simplified relation of the gene-pairs conditional expression with response to ICI. e Interaction plots comparing SHAP value dependencies between gene pairs trained on all cells vs T cells: CCL5 & CD38 (left), CCL4 & HLA-B (right). Expression of the first gene shown as x-axis position, and the expression of the interacting gene shown as coloring; SHAP value shown as y-axis position. f Waterfall plots showing SHAP value contributions to individual model predictions (sample prediction). Four examples of patients predicted as responders or non-responders, with differences in gene expression patterns contributing to the outcome predictions. Pre_P35 – Responder predicted correctly, Pre_P2 – Non-Responder predicted correctly, Pre_P28 – Responder predicted as Non-Responder, Pre_P3 – Non-Responder predicted as Responder.
Fig. 3
Fig. 3. RL prediction power.
a tSNE plots showing RL prediction scores (left) and immune cell clusters (right). Clusters are colored by group, and the RL prediction scores range from highly predictive to non-predictive (lower limit is determined as -3 and upper limit as 6 for visualization purposes). b Histogram of RL prediction distribution. c Bar plots showing the proportion of non-predictive (top), non-responders predictive (middle), and responders predictive (bottom) cells by cluster. d Stacked bar plots representing the proportion of RL labels (R predictive, non-predictive, NR predictive) for each patient sample. Top 31 samples are Non-Responders and bottom 17 samples are Responders. e Dot plot of the top most differentially expressed genes between the three RL bins, showing log fold change of key genes in non-responders predictive (NR predictive), non-predictive, and responders predictive (R predictive) groups.
Fig. 4
Fig. 4. T cell response and overall survival analysis in various cancer types.
a T Cell ROC curves showing the predictive power of the 11-gene signature score combined with RL-based filtration in distinguishing responders from non-responders across multiple cancer types. The blue curve represents the ROC curve before filtration, and the red curve represents the ROC curve after filtration. Box plots, separated into pre- and post-treatment samples (where available), depict the 11-gene signature scores before RL filtration. The datasets included are: Melanoma – Sade-Feldman et al., TNBC (Triple-Negative Breast Cancer) - Zhang et al., NSCLC (Non-Small Cell Lung Cancer) – Caushi et al., BCC (Basal Cell Carcinoma) – Yost et al., Glioblastoma – Mei et al., HER2+ & ER+ & TNBC - Bassez et al., Breast Cancer - Tietscher et al.. b Kaplan-Meier survival analysis of the 11 genes in the signature using bulk RNA-seq data across various cancer types. The survival curves illustrate the association between high and low expression of each gene. Plots include survival for genes – GAPDH, CD38, CCR7, HLA-DRB5, STAT1, GZMH, LGALS1, IFI6, EPSTI1, HLA-G, GBP5.

References

    1. Pardoll, D. M. The blockade of immune checkpoints in cancer immunotherapy. Nat. Rev. Cancer12, 252–264 (2012). - PMC - PubMed
    1. Sharma, P., Hu-Lieskovan, S., Wargo, J. A. & Ribas, A. Primary, adaptive, and acquired resistance to cancer immunotherapy. Cell168, 707–723 (2017). - PMC - PubMed
    1. Fares, C. M., Van Allen, E. M., Drake, C. G., Allison, J. P. & Hu-Lieskovan, S. Mechanisms of resistance to immune checkpoint blockade: why does checkpoint inhibitor immunotherapy not work for all patients? Am. Soc. Clin. Oncol. Educ. Book39, 147–164 (2019). - PubMed
    1. Ganesan, S. & Mehnert, J. Biomarkers for response to immune checkpoint blockade. Annu. Rev. Cancer Biol.4, 331–351 (2020).
    1. Toor, S. M., Sasidharan Nair, V., Decock, J. & Elkord, E. Immune checkpoints in the tumor microenvironment. Semin. Cancer Biol.65, 1–12 (2020). - PubMed

LinkOut - more resources