. 2025 Apr 1;15(1):11099.
doi: 10.1038/s41598-025-96046-y.

Lysyl-tRNA synthetase 1 promotes atherogenesis via autophagy-related secretion and inflammation

Affiliations

Lysyl-tRNA synthetase 1 promotes atherogenesis via autophagy-related secretion and inflammation

Kangmin Yun et al. Sci Rep. .

Abstract

Lysyl-tRNA synthetase 1 (KARS1), an aminoacyl-tRNA synthetase, was recently identified as a secreted pro-inflammatory agent. However, the vascular secretion and functions of KARS1 have not been characterized. This study investigated the secretion mechanisms of KARS1 and explored its functional roles in vascular biology. We found that KARS1 expression was upregulated by oscillatory shear stress, an atherogenic factor, suggesting the presence of free KARS1 dissociated from aminoacyl-tRNA synthetase complexes. Moreover, in the presence of Ca2+, serum starvation triggered free cytosolic KARS1 release from endothelial cells via secretory autophagy. Both phosphatidylinositol 3-phosphate kinase and caveolin-1 were either supplementary or essential for KARS1 secretion. Secreted KARS1 co-localized in the exosome fraction of post-culture media and was externally exposed. Further, secreted KARS1 inhibited shear-induced activation of various signaling molecules, including extracellular signal-regulated kinase, protein kinase B, and endothelial nitric oxide synthetase. Secreted KARS1 in atherosclerotic plaques also acted as an atherogenic or proinflammatory autocrine/paracrine molecule. Additionally, KARS1 participated in vessel alteration. Collectively, these findings describe novel vascular features of KARS1 in response to shear stress, providing insights into shear stress-controlling mechanisms of the vascular system.

Keywords: Cell apoptosis; KARS1; Laminar shear stress; Oscillatory shear stress; Secretory autophagy; Vessel alteration.


Conflict of interest statement

Declarations. Competing interests: The authors declare no competing interests. Ethics approval: All animal studies in this research were approved by the Animal Use Committee of Ewha Womans University (ESM-12–0191) and Chungbuk National University (CBNUA-2242–24-02). This study was performed in accordance with relevant guidelines and regulations. All methods are reported in accordance with ARRIVE guidelines. Consent for publication: All authors involved in this study have confirmed and approved the final manuscript.

Figures
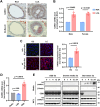
Fig. 1
Fig. 1
Lysyl-tRNA synthetase 1 (KARS1) is overexpressed by oscillatory shear stress (OSS) and secreted by serum starvation in endothelial cells. A. Immunohistochemistry staining shows KARS1 expression level in the partially ligated carotid artery of Apolipoprotein E knock-out (ApoE KO) mice fed a high-fat diet for two weeks. The right carotid artery (RCA) was normal and the left carotid artery (LCA) was ligated. The lipids were stained red with oil-red-O. Nuclei were counterstained with hematoxylin. Representative images are shown (n = 6). Scale bar = 100 μm. B. KARS1 mRNA levels analyzed by qPCR in the partially ligated carotid arteries of C57BL/6 mice fed a high-fat diet for two weeks. The data were statistically analyzed using Student’s t-test (n = 3, each). C. En face staining of the greater curvature (GC) and lesser curvature (LC) of the aortic arch in ApoE KO mouse tissue stained with an anti-KARS1 antibody (left panel). Nuclei were counterstained with DAPI. Representative images are presented (n = 3). Scale bar = 50 μm. KARS1 fluorescence intensity in the high-fat diet group quantified and analyzed using Student’s t-test (right panel). D. Bovine aortic endothelial cells (BAECs) were pre-treated with laminar shear stress (LSS) or OSS for 2 h. KARS1 mRNA levels were analyzed by qPCR. Static was a non-shear stress control. Data were statistically analyzed using one-way analysis of variance (ANOVA), followed by Tukey’s honest significant difference (HSD) test (n = 3). E. BAECs were transfected with a vector containing the KARS1 gene tagged with V5. Western blots for post-culture media and whole-cell lysates (WCL) of BAECs treated with OSS, growth media, and under serum starvation. CBB: Coomassie Brilliant Blue. β-Actin is the loading control. Representative blots are shown (n = 3). All bar graphs are presented as mean ± SEM.
Fig. 2
Fig. 2
Lysyl-tRNA synthetase 1 (KARS1) secretion is stimulated by cytosolic Ca2+ in endothelial cells. A. Bovine aortic endothelial cells (BAECs) were transfected with a vector containing the KARS1 gene tagged with V5 and serum-starved for 24 h. Western blotting (left panel) of whole-cell lysates (WCL), suspended dead cells (DC), and post-culture media obtained from BAECs treated with 1 μM A23187 and/or 100 μM EGTA/AM. β-Actin is the loading control. Representative blots are shown (n = 3). KARS1 blots were quantified using densitometry and analyzed using two-way analysis of variance (ANOVA), followed by Sidak’s correction (right panel). B. BAECs, after transfection with the vector carrying KARS1-V5 and 24 h serum starvation, were treated with 1 μM A23187 and/or Exo-1 for 15 min. Quantified blot data were analyzed using ANOVA, followed by Tukey’s honest significant difference (HSD) test (n = 3). C. Western blotting (left panel) was performed on WCL from BAECs transfected with an empty vector or a vector carrying KARS1-V5 and serum-starved for 24 h. Representative blots are shown (n = 4). Quantified blot data (right panels) analyzed using Student’s t-test. D–E. BAECs, after transfection of vector with KARS1-V5 and 24 h serum starvation, were treated with 500 μM AICAR or 10 μM Compound C (D). BAECs were transfected with a vector carrying PI3K-H1047R or treated with 10 nM wortmannin (E). Representative blots are shown (n = 3). Quantified blot data (right panel of E) were analyzed using one-way ANOVA followed by Tukey’s HSD test. F. Fura-2 fluorescence intensities were monitored for 30 min at 17-s intervals, starting 30 min after the media was changed from phosphate buffered saline to serum-starved media (left panel). The initial rates, represented by the slopes, are replotted as bar graphs (right panel). Slopes analyzed using a one-way ANOVA, followed by Tukey’s HSD test. All bar graphs are presented as mean ± SEM.
Fig. 3
Fig. 3
Ectopically overexpressed lysyl-tRNA synthetase 1 (KARS1) is secreted as exosome-associated complexes. A–B. Bovine aortic endothelial cells (BAECs) were transfected with an empty vector or a vector containing the KARS1 gene tagged with V5 and serum-starved for 24 h. In (B), transfected cells were treated with or without 1 μM A23187 for 15 min. The post-culture media were fractionated by ultracentrifugation steps: DC, suspended dead cells; EMP, endothelial microparticles; and media, exosome fractions. Western blotting was performed on whole-cell lysates (WCL) and fractionated media. β-Actin is the loading control. Representative blots are shown (n = 3). Data were analyzed using Student’s t-test. C. Each fraction (F1–10) from the sucrose gradient fractionation of BAECs and recombinant KARS1 protein (His-tagged rKARS1) were immunoblotted. D. Exosomes were prepared by collecting culture media from BAECs transfected with a vector carrying KARS1-V5. Input, post-culture media before exosome preparation; Remnant, non-exosomal fraction. Representative blots are shown (n = 3). E. Co-immunoprecipitation using anti-V5 antibody and subsequent western blotting. BAECs were transfected with a vector carrying KARS1-V5. Representative blots are shown (n = 3).
Fig. 4
Fig. 4
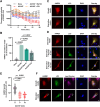
Lysyl-tRNA synthetase 1 (KARS1) secretion occurs through autophagy. A. Bovine aortic endothelial cells (BAECs) were transfected with a vector containing the KARS1 gene tagged with green fluorescent protein (GFP) and treated with 1 μM A23187, 250 nM bafilomycin A1 (Baf A1), or 50 μM chloroquine (CQ). Live-cell imaging was performed using a fluorescence microscope for 20 min at 1-min intervals. B. Quantification of KARS1 in post-culture media from BAECs transfected with a vector carrying KARS1-V5, pre-treated with 1 μM A23187, and 250 μM Baf A1 or 50 μM CQ. Secreted KARS1 was analyzed using two-way analysis of variance (ANOVA), followed by Tukey’s honest significant difference (HSD) test (n = 3). C–D. BAECs, co-transfected with vectors carrying KARS1-red fluorescent protein (RFP) and GFP-microtubule-associated proteins 1A/1B light chain 3B (LC3), were observed under a fluorescence microscope. In (D), the cells were treated with 1 μM A23187. Nuclei were counterstained with DAPI. Scale bar = 20 μm. Representative images are presented (n = 3). The Pearson correlation coefficients (ρ) in growth and starvation media are 0.95 ± 0.03 and 0.96 ± 0.02, respectively. E. The number of KARS1 puncta co-localized with LC3 in (D) is plotted and analyzed using one-way ANOVA, followed by Tukey’s HSD test. F. Fluorescence microscopy images of BAECs under the same conditions as panel (C). The cells were stained with LysoTracker and DAPI. Scale bar = 20 μm. Representative images are presented (n = 3). The Pearson correlation coefficients (ρ) for Lyso + LC3, Lyso + KARS1, and KARS1 + LC3 in growth media are 0.27, 0.78, and 0.56, respectively. In starvation media, the corresponding ρ values are 0.56, 0.86, and 0.77, respectively. All graphs are presented as mean ± SEM.
Fig. 5
Fig. 5
Degradative autophagy diminishes lysyl-tRNA synthetase 1 (KARS1) secretion. A. Wild-type (WT) and caveolin-1 knock-out (Cav-1 KO) mouse aortic endothelial cells (MAECs), transfected with a vector containing the KARS1 gene tagged with V5, were serum-starved for 24 h and treated with A23187 for 15 min. The post-culture media were fractionated as described in Fig. 3. Western blotting (left panel) was performed with β-Actin as the loading control. Representative blots are shown (n = 3). (WCL, whole-cell lysate; DC, suspended dead cells; EMP, endothelial microparticle). Quantified blot data of (A) and Figure S5A (right panel) analyzed using two-way analysis of variance (ANOVA) followed by Tukey’s honest significant difference (HSD) test. B. Quantified blot data concerning PI3K and p ~ PI3K levels in bovine aortic endothelial cells and MAECs analyzed using two-way ANOVA followed by Tukey’s HSD test (n = 3). C. WT and Cav-1 KO MAECs treated with 1 μM A23187 for various durations after transfection with the vector carrying KARS1-V5 and subjected to 24 h serum starvation. D. WT and Cav-1 KO MAECs transfected with a vector carrying KARS1-V5 harvested after treatment with 10 μg/ml cycloheximide (CHX). Immunoblotting was performed using an anti-V5 antibody and the results were quantified by densitometry. E–F. WT and Cav-1 KO MAECs, transfected with vector carrying KARS1-green fluorescent protein (GFP) (E) and GFP-microtubule-associated proteins 1A/1B light chain 3B (LC3) (F), were stained with LysoTracker and DAPI. Representative images (left panel) are presented (n = 3). Scale bar = 10 μm. Fluorescence images were quantified and analyzed using Student’s t-test (right panel). In (E), the Pearson correlation coefficients (ρ) for WT and Cav-1 KO are 0.85 ± 0.03 and 0.95 ± 0.01, respectively. In (F), the corresponding ρ values for WT and Cav-1 KO are 0.92 ± 0.01 and 0.94 ± 0.01, respectively. All graphs are presented as mean ± SEM.
Fig. 6
Fig. 6
Lysyl-tRNA synthetase 1 (KARS1) induces vascular alteration through impairing endothelial functions. A. Bovine aortic endothelial cells (BAECs) were pre-treated with post-culture media of BAECs, transfected with a vector containing the KARS1 gene tagged with V5, for 1 h, and exposed to laminar shear stress (LSS). Whole-cell lysates (WCLs) were subjected to immunoblotting. β-Actin is the loading control. Representative blots are shown (n = 3). Quantified data (top panel) analyzed using one-way analysis of variance (ANOVA) followed by Tukey’s honest significant difference (HSD) test. B. Serum-starved BAECs were pre-treated with recombinant KARS1 protein (His-tagged rKARS1) for 1 h and exposed to LSS. Western blotting (left panel) performed on WCLs. Representative blots are shown (n = 3). C. rKARS1-pretreated or untreated BAECs exposed to LSS. Nitric oxide (NO) levels analyzed using two-way ANOVA, followed by Tukey’s HSD test (n = 3). D. BAECs were treated with 10 ng/ml TNF-α or 500 nM rKARS1. Western blot signals quantified on a line graph by densitometry. E. BAECs and rat aortic smooth muscle cells (RAoSMCs) were stained with Annexin V and propidium iodide after pre-treatment with 500 nM rKARS1 for 24 h; fluorescence measured by flow cytometry. F. Apolipoprotein E knock-out (ApoE KO) mice were fed a high-fat diet and injected with rKARS1 or phosphate buffered saline (PBS) via the tail vein once weekly for three weeks. Quantified data show the thickness of the tunica media and the circumference and diameter of carotid artery (n = 8; Student’s t-test). All graphs are presented as mean ± SEM.

References

    1. Park, S. G., Choi, E. C. & Kim, S. Aminoacyl-tRNA synthetase–interacting multifunctional proteins (AIMPs): A triad for cellular homeostasis. IUBMB Life62, 296–302 (2010). - PubMed
    1. Kovaleski, B. J. et al. In vitro characterization of the interaction between HIV-1 gag and human lysyl-tRNA synthetase. J. Bio. Chem.281, 19449–19456 (2006). - PubMed
    1. Carmi-Levy, I. et al. Importin beta plays an essential role in the regulation of the LysRS-Ap(4)A pathway in immunologically activated mast cells. Mol. Cell. Biol.31, 2111–2121 (2011). - PMC - PubMed
    1. Yannay-Cohen, N. et al. LysRS serves as a key signaling molecule in the immune response by regulating gene expression. Mol. Cell34, 603–611 (2009). - PubMed
    1. Ofir-Birin, Y. et al. Structural switch of lysyl-tRNA synthetase between translation and transcription. Mol. Cell49, 30–42 (2013). - PMC - PubMed

Substances