. 2025 May;44(10):2949-2975.
doi: 10.1038/s44318-025-00420-5. Epub 2025 Apr 1.

Meru co-ordinates spindle orientation with cell polarity and cell cycle progression

Affiliations

Meru co-ordinates spindle orientation with cell polarity and cell cycle progression

Melissa M McLellan et al. EMBO J. 2025 May.

Abstract

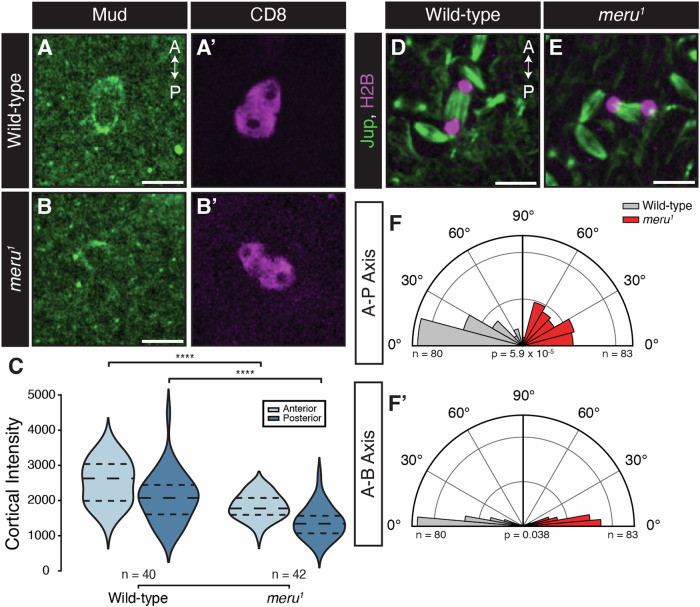
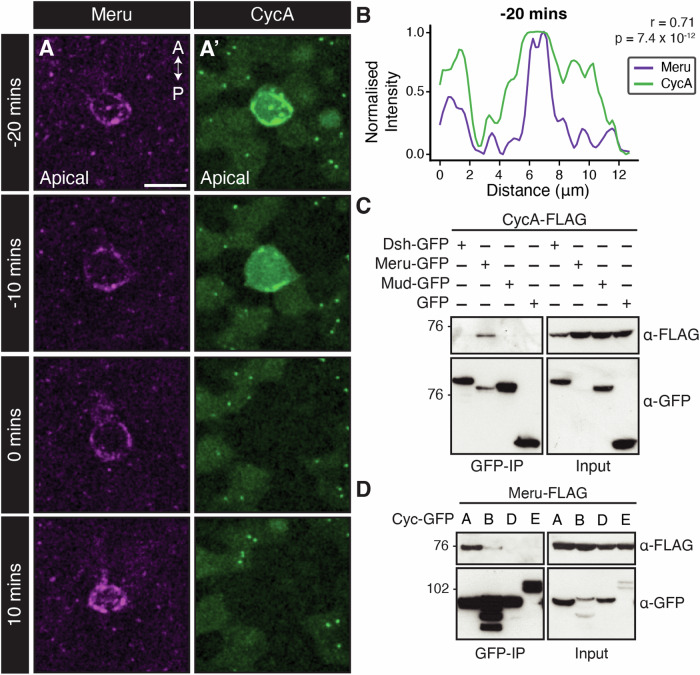
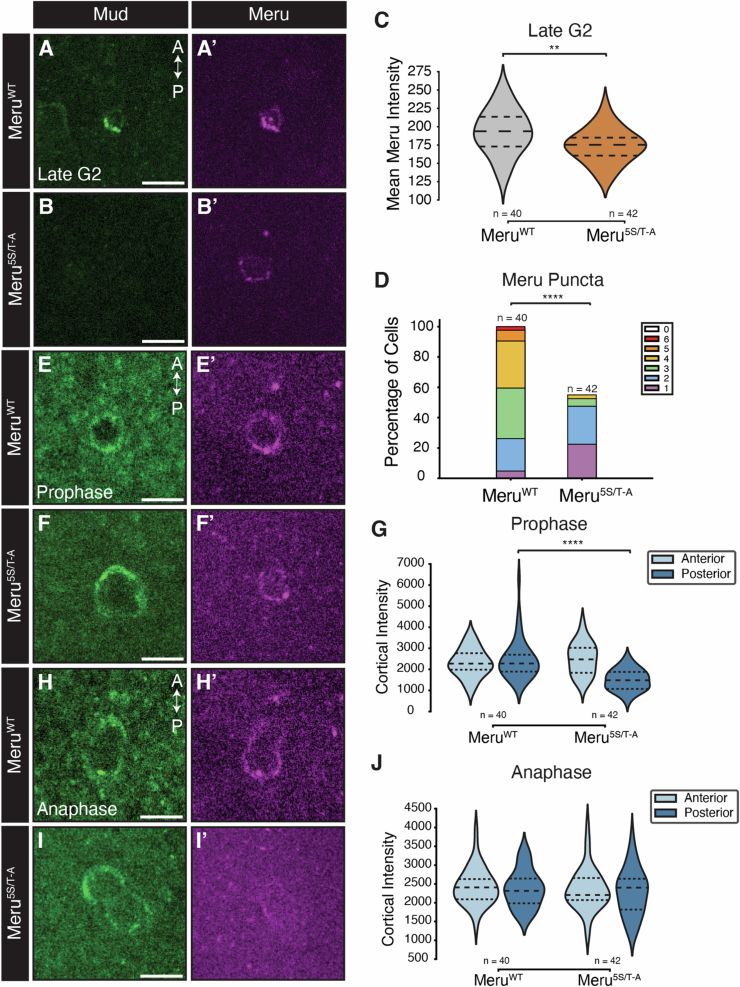
Correct mitotic spindle alignment is essential for tissue architecture and plays an important role in cell fate specification through asymmetric cell division. Spindle tethering factors such as Drosophila Mud (NuMA in mammals) are recruited to the cell cortex and capture astral microtubules, pulling the spindle in the correct orientation. However, how spindle tethering complexes read the cell polarity axis and how spindle attachment is coupled to mitotic progression remains poorly understood. We explore these questions in Drosophila sensory organ precursors (SOPs), which divide asymmetrically to give rise to epidermal mechanosensory bristles. We show that the scaffold protein Meru, which is enriched at the posterior cortex by the Frizzled/Dishevelled planar cell polarity complex, in turn recruits Mud, linking the spindle tethering and polarity machineries. Furthermore, Cyclin A/Cdk1 associates with Meru at the posterior cortex, promoting the formation of the Mud/Meru/Dsh complex via Meru and Dsh phosphorylation. Thus, Meru couples spindle orientation with cell polarity and provides a cell cycle-dependent cue for spindle tethering.

Keywords: Asymmetric Cell Division; Cell Polarity; Development; Drosophila; Spindle Orientation.


Conflict of interest statement

Disclosure and competing interests statement. The authors declare no competing interests.

Figures

Figure 1
Figure 1. Meru localises to the apical–posterior domain of the SOP.
(A) The current model of SOP spindle alignment where Mud is recruited to the anterior cortex by Pins/Gαi and to the posterior cortex through Fz/Dsh. Note that the extent of spindle tilt in the diagram is amplified compared with reality for illustrative purposes. (B, C) Brightfield images of the adult notum (B), wing (C), and anterior wing margin (C’) in animals expressing UAS-mK2-meru under the neurG4 driver. No visible defects (arrows indicating micro/macrochaetes) in the notum and wing sensory organs were observed. (DF) Maximum intensity projections of pupal nota at 16 h APF of neurG4 > UAS-mK2-meru (magenta, DF), Ecad-GFP (composite of Fig. EV1A–A’), Pon-GFP and Mud-GFP (green; D, E’ and F’, respectively) at 18 min prior to first indication of cytokinesis. SOP marked by a star. Scale bars = 5 µm. (G) Single brightest slice in (F, F’) plotted as line graph by measuring the grey value across the posterior domain as defined by Meru localisation normalised to the highest value in each channel. High Pearson’s coefficient (r) indicates a positive correlation. P value calculated using a two-tailed test. Source data are available online for this figure.
Figure 2
Figure 2. Meru is required for Dsh/Mud complex formation.
(A) Schematic of constructs that span Meru, Dsh and Mud used in co-IPs to characterise Meru binding in S2 cells. RA Ras-association domain, DIX DIshevelled and aXin domain, PDZ = PSD96, Dlg, ZO-1 domain, DEP Dishevelled, Egl-10 and Pleckstrin domain, CH Calponin Homology domain, PBD Pins-Binding Domain, TML Trans-Membrane-Like domain. (BD) Western blots of co-IP experiment using S2 cell lysates from transfected S2 cells, immunoprecipitated using and probed with the indicated antibodies. (B) Full-length Meru immunoprecipitates with Mud fragments containing the PBD and C-terminus. (C) Mud does not co-IP with full-length Dsh. The Meru/Mud interaction is used as a positive control (right-most lane). (D) Meru promotes Dsh/Mud complex formation. Source data are available online for this figure.
Figure 3
Figure 3. Meru loss leads to Mud mislocalisation and spindle alignment defects.
(A, B) Pupal notal confocal live-imaging of Mud-GFP (green, max projection of 6 slices) and UAS-cd8-mRFP driven by neurG4 (magenta, max projection of 4 slices) in a meru wild-type (A) and meru1 background (B) at 16 h APF at the first indication of cytokinesis. (C) Graph showing the intensity of cortical Mud at the anterior and posterior crescent of each genotype. Measurements were taken at anaphase. Both the anterior and posterior cortical Mud levels were significantly lower in the meru1 flies relative to the wild-type (P = 1.4 × 10−6 and P = 1.4 × 10−6, respectively). ****P < 0.0001 using a Mann–Whitney U test. Large and small dashed line represent the median and Q1/Q3, respectively. (D, E) Confocal live-imaging of neur-H2B-RFP (magenta) and Jupiter-GFP (green) in a meru wild-type (D) and meru1 background at approximate cytokinesis (E). (F) Graphs showing the spindle orientation of each genotype relative to the dorsal midline (F) and epithelial plane (F’). P values indicated using a Kolmogorov–Smirnov test. Scale bars = 10 µm. Number of SOPs imaged indicated on the panels from three nota in (C) or six wild-type or 4 meru1 nota, respectively, in (F, F’). Source data are available online for this figure.
Figure 4
Figure 4. Meru and CycA interact at the posterior cortex of SOPs.
(A) Confocal live-imaging of pupal nota (apical-most three sections) expressing neurG4 > UAS-mK2-meru (magenta) and CycA-GFP (green) of an SOP during mitosis at 16 h APF and 0 min indicating the first frame in cytokinesis. (B) Single brightest slice in (A, A’) at −20 min plotted as line graph by measuring the grey value across the posterior domain as defined by Meru localisation. High Pearson’s coefficient (r) indicates a positive correlation. P value calculated using a two-tailed test. (C, D) Western blots of co-IP experiment using cell lysates from transfected S2 cells, immunoprecipitated using α-GFP beads and probed using α-FLAG and α-GFP antibodies. (C) Meru, but not Dsh or C-terminal Mud (1452–1961), immunoprecipitates with CycA. (D) Meru associates with CycA and weakly with CycB, but not CycD or CycE. Scale bar = 10 µm. Source data are available online for this figure.
Figure 5
Figure 5. CycA docking is required for Meru localisation in vivo.
(A) Schematic of RxL motifs and Cdk1 S/T-P phosphorylation sites present in the Meru sequence. (B) Meru mutated at RxL motifs 258, 259 and 258/9 no longer immunoprecipitates with CycA. (BE) Western blots of co-IP experiment using cell lysates from transfected S2 cells, immunoprecipitated and probed using the indicated antibodies. Mutation of Meru RxL 258 and 259 sites disrupt the interaction between Meru and CycA (B), Mud (C) and Dsh (D), but not Baz (E). (F) Maximum intensity projections from confocal live-imaging of pupal nota at 16 h APF (0 min marking first frame in cytokinesis) show expression of UAS-mK2-meru (magenta) driven by neurG4 and CycA-GFP (green) during SOP mitosis. Scale bar = 10 µm. (G) Graphs showing the intensity of apical–posterior CycA crescent in Meru and MeruRxL animals at late G2. CycA cortical levels were significantly lower in MeruRxL relative to Meru cells (P = 2.6 × 10−5). Large and small dashed line represent the median and Q1/Q3, respectively. ****P < 0.0001 using a Mann–Whitney U test. Number of SOPs imaged indicated on the panels from three nota. Source data are available online for this figure.
Figure 6
Figure 6. Mutation of the Meru RxL motif results in decreased posterior Mud and abnormal spindle alignment.
(A) Western blot of co-IP experiment using cell lysates from transfected S2 cells, immunoprecipitated and probed using the indicated antibodies. Dsh does not immunoprecipitate with C-terminal Mud in the presence of MeruRxL. (B, C) Maximum intensity projections (6 slices) from confocal live-imaging of pupal nota at 16 h APF expressing Mud-GFP (green) and neurG4 > UAS-mK2-meruWT (B) or neurG4 > UAS-mK2-meruRxL (magenta) (C) in a meru1 background. (D) Graph showing the intensity of cortical Mud at the anterior and posterior crescent of each genotype. Measurements were taken at anaphase. Posterior MeruRxL is significantly lower than MeruWT (P = 1.9 × 10−8). ****P < 0.0001 using a Mann–Whitney U test. Large and small dashed line represent the median and Q1/Q3, respectively. (E, F) Maximum intensity projections from confocal live-imaging of neur-H2B-RFP (magenta) and Jupiter-GFP (green) in a neur > UAS-mK2-meruWT (E) and neur > UAS-mK2-meruRxL background (F). (G) Graphs showing the spindle orientation of each genotype relative to the dorsal midline (G) and epithelial plane (G’). P values indicated for Kolmogorov–Smirnov tests. Scale bars = 10 µm. Number of SOPs imaged from three animals indicated on the panels from three animal. Source data are available online for this figure.
Figure 7
Figure 7. Cdk1 phosphorylation sites are required for Meru binding to Mud and phospho-Dsh.
(A) MS/MS spectrum corresponding to modification (phosphorylation) to the Meru T496 site. Fragment ions are indicated in red. Fragment ions with neutral loss are in yellow. (B) Phosphorylation of Meru at S60 and T496 was detected in MeruWT but not in the MeruRxL mutant. Label-free quantification (LFQ) intensities were plotted for each sample and phosphorylation site. (C, D) Western blots of co-IP experiment using cell lysates from transfected S2 cells, immunoprecipitated and probed using the indicated antibodies. Meru mutated to Alanine at five S/T-P phosphorylation sites disrupts co-IP with C-terminal Mud (1452–1961), but not Baz or Dsh (C), unless the Dsh T22 phosphorylation site was also mutated (D). Source data are available online for this figure.
Figure 8
Figure 8. Meru Cdk1 phosphorylation sites promote Mud posterior recruitment and SOP spindle orientation.
(A, B) Maximum intensity projections (6 slices) of confocal live-imaging of pupal nota at 16 h APF expressing Mud-GFP (green) and neurG4 > UAS-mK2-meruWT (A) or neurG4 > UAS-mK2-meru5S/T-A (magenta) (B) in a meru1 background at metaphase (C) Graph showing the intensity of cortical Mud at the anterior and posterior crescent of each genotype. At metaphase, posterior Mud is significantly lower in Meru5S/T-A than MeruWT animals (P = 2.24 × 10−3). **P < 0.01 using a Mann–Whitney U test. Large and small dashed line represent the median and Q1/Q3, respectively. (D, E) Confocal live-imaging of neur-H2B-RFP (magenta) and Jupiter-GFP (green) in a neur > UAS-mK2-meruWT (D) and neur > UAS-mK2-meru5S/T-A background (E). (F) Graphs showing the spindle orientation of each genotype relative to the dorsal midline (F) and epithelial plane (F’). P values indicated for Kolmogorov–Smirnov tests. (C, F, F’) The number of SOPs imaged indicated on the panels from three nota. (G) Diagram showing our proposed model for Meru function in SOP spindle tethering. Meru, which is recruited to the posterior cortex of SOPs by Dsh, promotes posterior Mud recruitment. The Meru/Mud interaction is dependent on the docking of CycA to Meru at the 258/9 RxL motif and is regulated by Cdk1 phosphorylation of Meru. Mud and Dsh may also be Meru-dependent CycA/Cdk1 substrates at the SOP posterior cortex. Data information: Scale bars in (A, B, D, E) = 10 µm. Source data are available online for this figure.
Figure EV1
Figure EV1. Posterior–apical localisation of Meru occurs prior to SOP mitosis and persists throughout division.
(A-B’) Maximum intensity projections of apical-most three sections of pupal nota live-imaged on a confocal microscope at 16 h APF, 0 min marking the first frame indicating cytokinesis, of neurG4 > UAS-mK2-meru (magenta; A, B, see composite in Fig. 1D), co-expressed with Ecad-GFP and Mud-GFP (green; A’, B’, respectively). (CC”) Single brightest slice in (B, B’) plotted as line graphs by measuring the grey value across the posterior domain as defined by Meru localisation normalised to highest value in each channel. High Pearson’s coefficient (r) indicates positive correlation. P values calculated using a two-tailed test. Scale bars = 5 µm. Source data are available online for this figure.
Figure EV2
Figure EV2. The RxL motifs of Meru.
(A) The amino acid (aa) positions of the six RxL motifs identified in the Meru sequence are indicated on the left. On the right is the sequence alignment of all RxL motifs. Orange indicates the R/K and the L is labelled in blue at position 0. The hydrophobic aa is marked in purple and the grey boxes indicate the two aa that were mutated to Alanine in RxL mutants. (B, C) Western blots of co-IP experiment using cell lysates from transfected S2 cells, immunoprecipitated and probed using the indicated antibodies. (B) CycA immunoprecipitates with each Meru RxL motif mutant, except when Meru 258/9 is mutated to Alanines. (C) CycA depletion by RNAi reduced Meru/Mud association. Source data are available online for this figure.
Figure EV3
Figure EV3. 258/9 RxL motif mutant Meru no longer binds CycA and is mislocalised in vivo.
(AD) Maximum intensity projections of pupal nota live-imaging at 16 h APF, 0 min marking the first frame indicating cytokinesis, of neurG4 > UAS-mK2-meruRxL and neurG4 > UAS-mK2-meruWT (magenta; A–C and D, respectively), co-expressed with nuclear nls-GFP, apical Ecad-GFP, basolateral Dlg-GFP and CycA-GFP (green; panels A’, B’, C’ and D’, respectively). Scale bars = 10 µm. Source data are available online for this figure.
Figure EV4
Figure EV4. Overexpression of Cdk1 and CycA promotes the Meru/Mud interaction.
(A, C) Western blots of co-IP experiment using cell lysates from transfected S2 cells, immunoprecipitated and probed using the indicated antibodies. (A) Overexpression of Cdk1/CycA increases the amount of Meru binding to Mud. (B) MeruRxL has decreased interaction with CycA, Cdk1, Mud and Dsh relative to MeruWT in a peptide identification analysis by MS (N = 2). (C) No single Meru S/T-P phosphosite is essential to co-IP with C-terminal Mud. Source data are available online for this figure.
Figure EV5
Figure EV5. Posterior cortical Mud levels return by anaphase in Meru5S/T-A mutants.
(AB’) Single slice from confocal live-imaging of pupal nota at 16 h APF expressing Mud-GFP (green; A, B) and neurG4 > UAS-mK2-meruWT (magenta; A’) or neurG4 > UAS-mK2-meru5S/T-A (magenta; B’) at late G2. (C) Graph showing the mean intensity of posterior cortical Meru during late G2 in MeruWT and Meru5S/T-A (P = 2.7 × 10−3). (D) Graph displaying the average number of Meru puncta at the posterior cortex in late G2. Puncta of the Meru5S/T-A mutant are significantly decreased relative to MeruWT (P = 9.10 × 10−15). (EF’) Maximum intensity projections (6 slices; E, F) from confocal live-imaging of pupal nota at 16 h APF expressing Mud-GFP (green; E, F) and neurG4 > UAS-mK2-meruWT (magenta; E’) or neurG4 > UAS-mK2-meru5S/T-A (magenta; F’) in a meru1 background at prophase. (G) Graph showing the intensity of cortical Mud at the anterior and posterior crescent of each genotype at prophase. Posterior Meru5S/T-A is significantly lower than MeruWT (P = 1.61 × 10−7). (HI’) Maximum intensity projections (6 slices; H, I) from confocal live-imaging of pupal nota at 16 h APF expressing Mud-GFP (green; H, I) and neurG4 > UAS-mK2-meruWT (magenta; H’) or neurG4 > UAS-mK2-meru5S/T-A (magenta; I’) in a meru1 background at anaphase. (J) Graphs showing the intensity of cortical Mud at the anterior and posterior crescent of each genotype at anaphase, where there is no measurable difference at anaphase (P = 0.47). **P < 0.01 and ****P < 0.0001 using a Mann–Whitney U test. Large and small dashed lines in violin plots represent the median and Q1/Q3, respectively. Scale bars = 10 µm. (C, D, G, J) Number of SOPs imaged indicated on the panels from 3 nota. Source data are available online for this figure.
Figure EV6
Figure EV6. Loss of the Pins RxL motif results in delayed cortical localisation.
(A) BLAST search results for novel [R/K]-[R/K]-L-L-x[7]-[S/T]-P (RRLL) motifs resulted in nine proteins of interest, including Meru, Pins, Gukh and AurA, all of which are involved in spindle orientation. (B, C) Maximum intensity projections from confocal live-imaging of pupal nota at 16 h APF, 0 min marking first frame in cytokinesis, shows expression of UAS-mK2-PinsWT (B) and UAS-mK2-PinsRxL (C) driven by neurG4 during SOP mitosis. Scale bars = 10 µm. Source data are available online for this figure.

Similar articles

References

    1. Albertson R, Chabu C, Sheehan A, Doe CQ (2004) Scribble protein domain mapping reveals a multistep localisation mechanism and domains necessary for establishing cortical polarity. J Cell Sci 117(25):6061–6070 - PubMed
    1. Albertson R, Doe CQ (2003) Dlg, Scrib and Lgl regulate neuroblast cell size and mitotic spindle asymmetry. Nat Cell Biol 5(2):166–170 - PubMed
    1. Axelrod JD, Miller JR, Shulman JM, Moon RT, Perrimon N (1998) Differential recruitment of dishevelled provides signaling specificity in the planar cell polarity and Wingless signaling pathways. Genes Dev 12(16):2610–2622 - PMC - PubMed
    1. Banerjee JJ, Aerne BL, Holder MV, Hauri S, Gstaiger M, Tapon N (2017) Meru couples planar cell polarity with apical-basal polarity during asymmetric cell division. eLife 6:1–21 - PMC - PubMed
    1. Bastock R, Strutt H, Strutt D (2003) Strabismus is asymmetrically localised and binds to Prickle and Dishevelled during Drosophila planar polarity patterning. Development 130:3007–3014 - PubMed

LinkOut - more resources