. 2025 Apr;31(4):1183-1194.
doi: 10.1038/s41591-025-03532-x. Epub 2025 Apr 1.

An inflammatory biomarker signature of response to CAR-T cell therapy in non-Hodgkin lymphoma

Affiliations

An inflammatory biomarker signature of response to CAR-T cell therapy in non-Hodgkin lymphoma

Sandeep S Raj et al. Nat Med. 2025 Apr.

Abstract

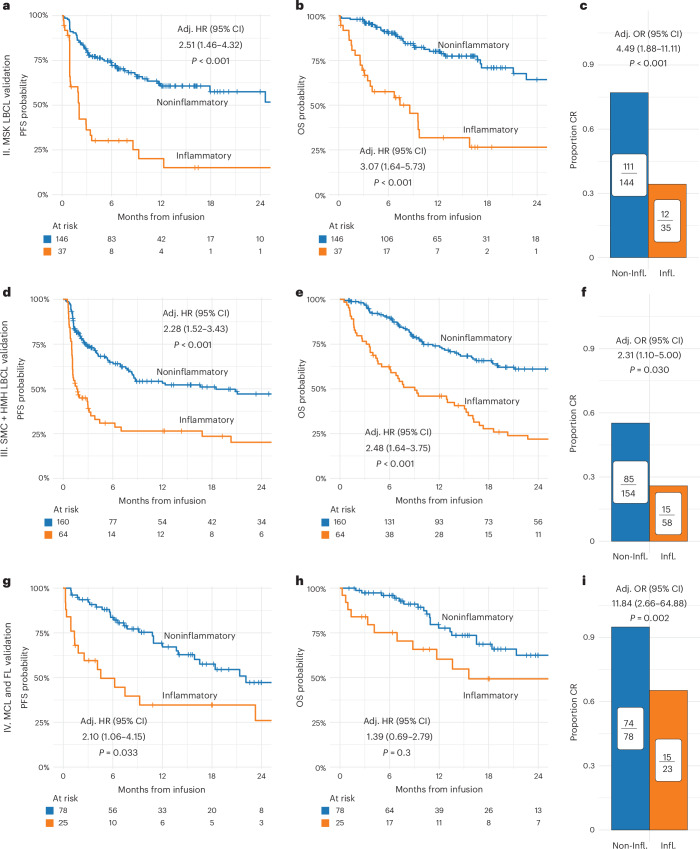
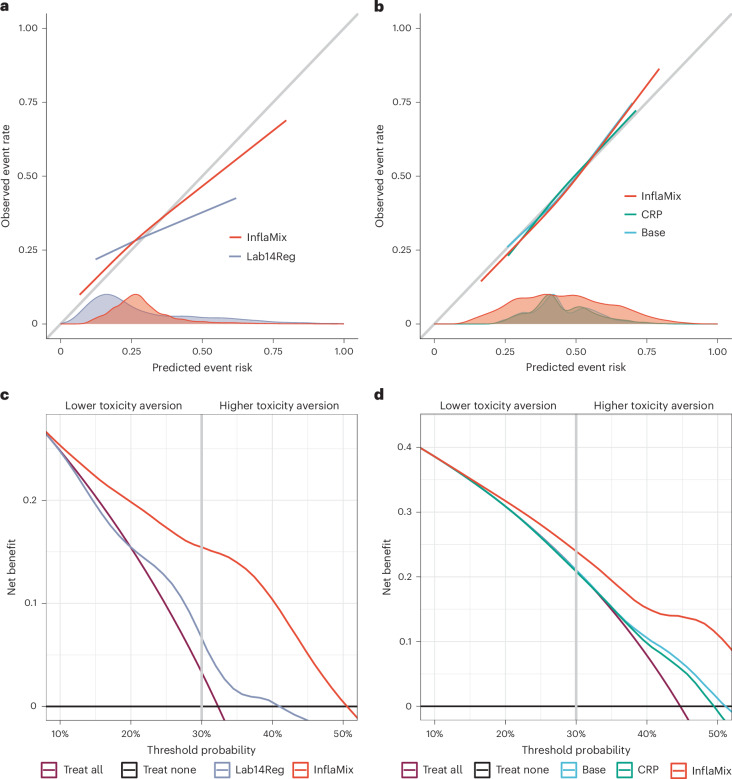
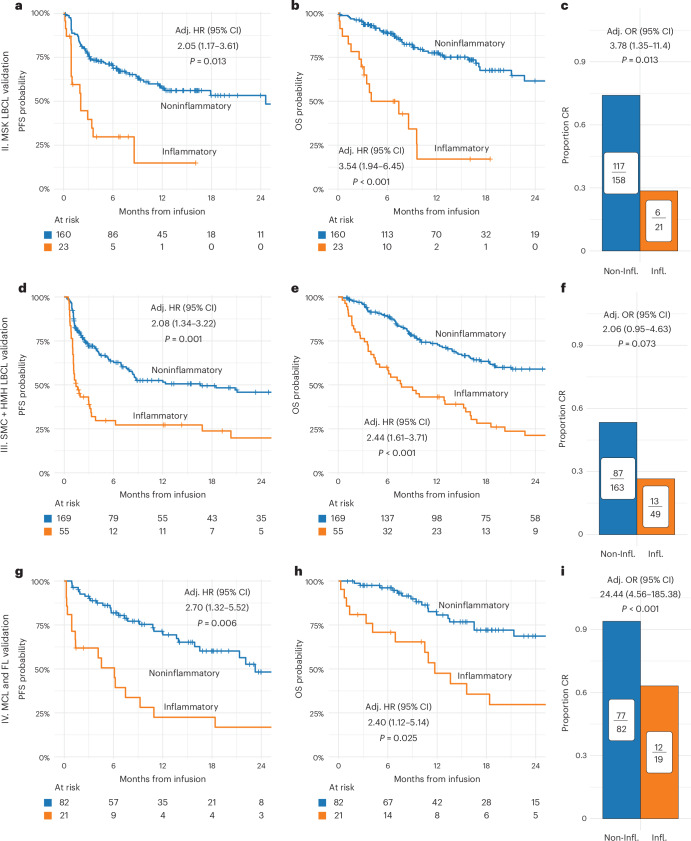
Disease progression is a substantial challenge in patients with non-Hodgkin lymphoma (NHL) undergoing chimeric antigen receptor T cell (CAR-T) therapy. Here we present InflaMix (INFLAmmation MIXture Model), an unsupervised quantitative model integrating 14 pre-CAR-T infusion laboratory and cytokine measures capturing inflammation and end-organ function. Developed using a cohort of 149 patients with NHL, InflaMix revealed an inflammatory signature associated with a high risk of CAR-T treatment failure, including increased hazard of death or relapse (hazard ratio, 2.98; 95% confidence interval, 1.60-4.91; P < 0.001). Three independent cohorts comprising 688 patients with NHL from diverse treatment centers were used to validate our approach. InflaMix consistently and reproducibly identified patients with a higher likelihood of disease relapse and mortality, and it provided supplementary predictive value beyond established prognostic markers, including tumor burden. Moreover, InflaMix exhibited robust performance in cases with missing data, maintaining accuracy when considering only six readily available laboratory measures. These findings show that InflaMix is a valuable tool for point-of-care clinical decision-making in patients with NHL undergoing CAR-T therapy.


Conflict of interest statement

Competing interests: R.S. reports speaker honorarium from Incyte. A.A. reports honoraria from AbbVie and has consulting and advisory roles with Takeda, Gilead, Novartis, Roche and Bristol Myers Squibb. L.A.L. served as a consultant and/or speaker bureau for Kite/Gilead, Beigene, Pharmacyclics, AbbVie, Genmab, SeaGen, Janssen, AstraZeneca, Eli Lilly, Epizyme, TG Therapeutics, Merck and ADC Therapeutics. A.I. owns stock and has ownership interests in Cota Healthcare. He also reports honoraria from MJH Life Sciences and Pfizer. He served as a consultant and/or speaker bureau for TG Therapeutics, Secura Bio, AstraZeneca and Seattle Genetics. Z.E.-P. serves on Genmab advisory board. J.U.P. reports research funding, intellectual property fees and travel reimbursement from Seres Therapeutics and consulting fees from Da Volterra, CSL Behring and MaaT Pharma. He serves on an advisory board of and holds equity in Postbiotics Plus Research. He has filed intellectual property applications related to the microbiome (reference numbers #62/843,849, #62/977,908 and #15/756,845). R.J.L. has served as a consultant for Kite. G.L.S. has received research funding from Janssen, Amgen, BMS, Beyond Spring, GPCR and Recordati and serves on the DSMB for Arcellx. M.S. served as a paid consultant for McKinsey & Company, Angiocrine Bioscience, Inc., and Omeros Corporation; received research funding from Angiocrine Bioscience, Inc., Omeros Corporation, Amgen Inc., Bristol Myers Squibb, and Sanofi; served on ad hoc advisory boards for Kite – A Gilead Company, and Miltenyi Biotec; and received honoraria from i3Health, Medscape, CancerNetwork, Intellisphere LLC, Curio Science LLC, and IDEOlogy. S.A.G. receives research funding from Amgen, Johnson & Johnson, Takeda, Celgene, Actinium, Sanofi, Miltenyi, Kite and EUSA. He is on the advisory boards of Amgen, Johnson & Johnson, Takeda, Celgene, Actinium, Sanofi, Miltenyi, Novartis, Kite, Jazz, BMS, Spectrum Pharma and EUSA Omeros. J.H.P. received consulting fees from Affyimmune Therapeutics, Amgen, Autolus, Be Biopharma, Beigene, Bright Pharmaceutical Services, Curocel, Kite, Medpace, Minerva Biotechnologies, Pfizer, Servier, Sobi and Takeda; received honoraria from OncLive, Physician Education Resource and MJH Life Sciences; serves on scientific advisory board of Allogene Therapeutics and Artiva Biotherapeutics; and received institutional research funding from Autolus, Genentech, Fate Therapeutics, Incyte, Servier and Takeda. M.L.P. has served as a consultant for Novartis, Cellectar, Synthekine, Kite, Seres, Magenta, WindMIL, Rheos, Nektar, Notch, Priothera, Ceramedix, Lygenesis and Pluto. G.S. has received in the last 12 months financial compensation for participating in advisory boards or consulting from AbbVie, Atbtherapeutics, Beigene, BMS/Celgene, Debiopharm, Genentech/Roche, Genmab, Incyte, Ipsen, Janssen, Kite/Gilead, Loxo/Lilly, Merck, Molecular Partners, Nordic Nanovector, Novartis, Nurix and Orna. He has also received research support managed by his institution from Genentech, Janssen and Ipsen. He is a shareholder of Owkin. B.D.G. has received honoraria for speaking engagements from Merck, Bristol Myers Squibb and Chugai Pharmaceuticals; has received research funding from Bristol Myers Squibb and Merck; and has been a compensated consultant for Darwin Health, Merck, PMV Pharma, Shennon Biotechnologies and Rome Therapeutics, of which he is a co-founder. He additionally has intellectual property rights with Rome Therapeutics and the Icahn School of Medicine at Mount Sinai. He has served in an advisory role at Merck Sharpe and Dohme and Darwin Health. M.-A.P. reports honoraria from Adicet, Allogene, Allovir, Caribou Biosciences, Celgene, Bristol Myers Squibb, Equilium, Exevir, ImmPACT Bio, Incyte, Karyopharm, Kite/Gilead, Merck, Miltenyi Biotec, MorphoSys, Nektar Therapeutics, Novartis, Omeros, OrcaBio, Syncopation, VectivBio AG and Vor Biopharma. He serves on DSMBs for Cidara Therapeutics, Medigene and Sellas Life Sciences and the scientific advisory board of NexImmune. He has ownership interests in NexImmune, Omeros and OrcaBio. He has received institutional research support for clinical trials from Allogene, Incyte, Kite/Gilead, Miltenyi Biotec, Nektar Therapeutics, and Novartis. M.R.M.v.d.B. has received research support and stock options from Seres Therapeutics and stock options from Notch Therapeutics and Pluto Therapeutics; he has received royalties from Wolters Kluwer; has consulted, received honorarium from or participated in advisory boards for Seres Therapeutics, Vor Biopharma, Rheos Medicines, Frazier Healthcare Partners, Nektar Therapeutics, Notch Therapeutics, Ceramedix, Lygenesis, Pluto Therapeutics, GlaxoSmithKline, Da Volterra, Thymofox, Garuda, Novartis (spouse), Synthekine (spouse), Beigene (spouse) and Kite (spouse); he has IP licensing with Seres Therapeutics and Juno Therapeutics; and holds a fiduciary role on the Foundation Board of DKMS (a nonprofit organization). Memorial Sloan Kettering Cancer Center has institutional financial interests relative to Seres Therapeutics. The other authors declare no competing interests. The funders had no role in study design, data collection and analysis, decision to publish or preparation of the manuscript.

Figures

Fig. 1
Fig. 1. Gaussian mixture model of 14 pre-CAR-T infusion labs (InflaMix) identifies an inflammatory signature associated with higher tumor burden and poor clinical outcomes.
a, Pearson correlation matrix of center-scaled values of 14 labs and cytokines normalized by ULN in the model derivation cohort (n = 149), with FDR-corrected P values of correlation tests against the null of zero correlation. Ferritin and CRP values are log-10 transformed. b, Heatmap of median scaled lab values by cluster. The text describes unscaled values with IQR. c, Scaled lab values projected in UMAP space, colored by cluster (inflammatory, n = 39; noninflammatory, n = 108). The sizes of the dots represent cluster membership probabilities in percentage corresponding to the assigned cluster. df, Comparing measures of tumor burden between clusters in the derivation cohort. Inferences by FDR-corrected Wilcoxon tests for LDH (d), MTV (e) and (f) SUVmax (f). g, Variable importance of labs in predicting cluster assignment, derived across 100 independent runs of cross-validated random forest models. Boxplots depict the median bounded by the first and third quartile values. Boxplot whiskers depict 1.5 times the IQR beyond the boxplot hinges. hj, Rates of grade 2–4 CRS (h), grade 2–4 ICANS (i) and CR by day 100 (j) by cluster. Odds ratios for no CR by day 100 were estimated with 95% CI using logistic regression adjusted for age, primary refractory disease, costimulatory domain and prelymphodepletion LDH elevated above ULN. k,l, Kaplan-Meier survival estimates for PFS (k) and OS (l) stratified by cluster. HRs were estimated with 95% CI using Cox proportional hazard regression adjusted for age, primary refractory disease, costimulatory domain, and prelymphodepletion LDH elevated above ULN. Significance of cluster associations with clinical outcomes was determined by the Wald test. All tests were two sided with a significance level of 0.05. Adj., adjusted; CI, confidence interval; CR, complete response; FDR, false discovery rate; HR, hazard ratio; Infl., inflammatory cluster; IQR, interquartile range; MTV, metabolic tumor volume; Non-Infl., noninflammatory cluster; OR, odds ratio; SUV, standardized uptake value; ULN, upper limit of normal; UMAP, Uniform Manifold Approximation and Projection. Source data
Fig. 2
Fig. 2. InflaMix-assigned clustering reproducibly associates with increased risk of disease progression or death across independent cohorts.
ai, Kaplan-Meier survival estimates of PFS and OS and rates of CR by day 100 by InflaMix clustering across all three validation cohorts. Odds ratios of no CR by day 100 and HRs estimated with 95% CI using regression models adjusted for age, primary refractory disease, costimulatory domain and prelymphodepletion LDH elevated above ULN. Estimates for PFS (a), OS (b) and rates of CR by day 100 (c) in the MSK cohort (Cohort II); and PFS (d), OS (e) and rates of CR by day 100 (f) in the SMC + HMH LBCL cohort (Cohort III). Estimates for PFS (g), OS (h) and rates of CR by day 100 (i) in the MCL and FL cohort (Cohort IV). Regression models used for Cohort IV adjusted for age, primary refractory disease, lymphoma subtype (MCL versus FL), and prelymphodepletion LDH elevated above ULN. Significance of cluster associations with clinical outcomes was determined by the Wald test. All tests were two sided with a significance level of 0.05. HMH, John Theurer Cancer Center of Hackensack Meridian Health.
Fig. 3
Fig. 3. InflaMix-informed prediction models for PFS at 6 months outperform models trained with conventional biomarkers and without mixture modeling.
All models were trained using the InflaMix model-derivation cohort (Cohort I). The InflaMix model uses base clinical features (age, costimulatory domain, primary refractory disease, elevated prelymphodepletion LDH) and InflaMix score (log-transformed cluster assignment probability). Conventional model benchmarks include: Base, base clinical features only; CRP, base clinical features and prelymphodepletion CRP; Lab14Reg, regularized regression model of base clinical features and all 14 analytes used to develop InflaMix. All models were trained using Cox proportional hazards regression in the same MSK cohort InflaMix was derived from. Prediction performance was assessed using an independent validation cohort of patients with LBCL treated at MSK, SMC, or HMH. For each set of model comparisons, the validation cohort was divided into a group used to recalibrate the original model and an independent test group, repeated 100 times with twofold cross-validation for an unbiased assessment. Calibration curves, density plots, and net benefit here are evaluated using risk estimates aggregated across all repeated validation folds. A positive event here is defined as disease progression, relapse, or death by 6 months. a,b, Calibration curves of InflaMix-informed models compared to those of conventionally trained models (Lab14Reg (a), Base and CRP (b)). c,d, Decision curve analyses comparing net benefit conferred by InflaMix-informed models against conventional models (Lab14Reg (c), Base and CRP (d)) in patients who obtain a PR by day +30 after CAR-T infusion. Net benefit is evaluated for consolidation therapies across low (20%–30%) and high (30%–40%) probability threshold ranges for patients and clinicians who have lower or higher risk aversions to consolidation therapy toxicity, respectively. We suggest that bispecific T cell engager (that is, CD3xCD20 bispecific antibody) and auto-HCT consolidation should be evaluated over high probability thresholds but recognize others may consider lower threshold probabilities for bispecific antibody therapy depending on individual preferences. Auto-HCT, autologous hematopoietic cell transplantation; PR, partial response.
Fig. 4
Fig. 4. InflaMix-assigned clustering reproducibly associates with increased risk of disease progression or death across independent cohorts when using only a limited six-lab panel of albumin, AST, ALP, Hgb, CRP and LDH.
ai, Kaplan-Meier survival estimates of PFS and OS and rates of CR by day 100 by InflaMix clustering with the six-lab panel across all three validation cohorts. Odds ratios of no CR by day 100 and HRs estimated with 95% CI using regression models adjusted for age, primary refractory disease, costimulatory domain, and prelymphodepletion LDH elevated above ULN. Estimates for PFS (a), OS (b) and rates of CR by day 100 (c) in the MSK LBCL cohort (Cohort II); PFS (d), OS (e) and rates of CR by day 100 (f) in the SMC + HMH LBCL cohort (Cohort III). Estimates for PFS (g), OS (h) and rates of CR by day 100 (i) in the MCL and FL cohort (Cohort IV). Regression models used for Cohort IV adjusted by age, primary refractory disease, disease (MCL versus FL), and prelymphodepletion LDH elevated above ULN. Significance of cluster associations with clinical outcomes was determined by the Wald test. All tests were two sided with a significance level of 0.05.
Fig. 5
Fig. 5. Cluster transitions between CAR-T treatment decision time points are associated with changes in survival outcomes.
Patients across all cohorts are included in these analyses. a, Alluvial plot showing patient transitions between cluster assignments across apheresis, lymphodepletion and CAR-T infusion. Alluvia are colored by whether patients were treated with bridging therapy after apheresis. b, Heatmaps of median normalized preapheresis and prelymphodepletion laboratory values scaled by distributions of ULN-normalized preinfusion lab values in the model derivation cohort,. Text reports unscaled, nonnormalized medians with IQR. NA signifies laboratory measures not available at the preapheresis timepoint. c,e, Estimates of PFS (c) and OS (e) in patients who transition cluster assignments between apheresis and infusion (inflammatory cluster at apheresis to noninflammatory cluster at infusion (I. → NI.; dark orange dashed curve), noninflammatory cluster at apheresis to inflammatory cluster at infusion (N → I.; dark blue dashed curve), and no change (I.→ I.; bright orange solid curve, NI. → NI.; bright blue solid curve)). For patients who are NI. at apheresis, we report HRs of transitioning to I. at infusion versus not transitioning clusters. For patients who are I. at apheresis, we report HRs of transitioning to NI. at infusion versus not transitioning clusters. d,f, Estimates of PFS (d) and OS (f) for transitions between clusters as described above, except between lymphodepletion and infusion. HRs estimated with 95% CIs using regression models adjusted for age, primary refractory disease, costimulatory domain, bridging therapy, disease and prelymphodepletion LDH elevated above ULN. Censor marks are omitted from Kaplan-Meier curves for the sake of visual clarity. These associations remain significant if all cluster assignments are performed using only a six-lab panel (Supplementary Table 2). Significance of cluster transition associations with clinical outcomes was determined by the Wald test. All tests were two sided with a significance level of 0.05. Units of measure: albumin and Hgb, grams per deciliter; ALP, AST and LDH, units per liter; CRP and Tbili, milligrams per deciliter; D-dimer, micrograms per milliliter; ferritin, nanograms per milliliter; IL-6, IL-10 and TNF, picograms per milliliter; Plt and WBC, thousands of cells per microliter blood.
Extended Data Fig. 1
Extended Data Fig. 1. Workflow visual abstract.
(a) Our workflow involved 1) using 14 preinfusion laboratory measures in a model derivation cohort from MSK to build a Gaussian mixture model we named InflaMix. InflaMix clustered patients into two groups, one with an inflammatory blood profile and another with a noninflammatory profile. 2) We then evaluated the association between inflammatory cluster assignment by InflaMix and clinical outcomes after CAR-T therapy. 3). Finally, we then used InflaMix to predict patient cluster assignment in three independent validation cohorts (Cohort 2–MSK patients with LBCL, Cohort 3–SMC and HMH patients with LBCL, and Cohort 4–patients from all 3 centers with either FL or MCL) and evaluate their associations with clinical outcomes. (b) In developing InflaMix from the derivation cohort (Cohort I), we 1) normalized every laboratory value by their upper limit of normal to standardize measurements across different assays. 2) We then systemically log transformed any laboratory measures with distribution skew > 1 that improved > 90% by log transformation. 3) Laboratory values for patients across all cohorts were then scaled by the mean and standard deviation of laboratory values in the derivation cohort. These normalized, log-transformed, and scaled values are then used for cluster assignment by mixture modeling. These cluster assignments were then used as predictors in fitted regression models of disease response and survival to evaluate their associations with clinical outcomes. FL, follicular lymphoma; HMH, Hackensack Meridian Health; MCL, mantle cell lymphoma; MSK, Memorial Sloan Kettering Cancer Center; SMC, Sheba Medical Center.
Extended Data Fig. 2
Extended Data Fig. 2. Consort diagram.
Multicenter observational study with 4 independent cohorts. A Gaussian mixture model of 14 preinfusion laboratory and cytokine assays (InflaMix) defined a cluster enriched for patients with elevated inflammatory markers in the MSK model derivation cohort (Cohort I). This “inflammatory cluster” reproducibly associated with and was predictive of poor clinical outcomes across all 4 cohorts. Three independent validation cohorts included: 1) MSK LBCL cohort (Cohort II); 2) SMC + HMH LBCL cohort (Cohort III); 3) MCL and FL cohort (Cohort IV, all centers). FL, follicular lymphoma; HMH, John Theurer Cancer Center of Hackensack Meridian Health; lisocel, lisocabtagene maraleucel; MCL, mantle cell lymphoma; MSK, Memorial Sloan Kettering Cancer Center; PMBCL, primary mediastinal large B cell lymphoma; SMC, Sheba Medical Center.
Extended Data Fig. 3
Extended Data Fig. 3. InflaMix is a 2-cluster Gaussian mixture model of pre-CAR-T laboratory and cytokine measurements that jointly considers covariance across lab features and optimizes cluster separation and entropy.
(a) Integrated complete likelihood criteria of various Gaussian mixture models with varying numbers of clusters built from pre-CAR-T labs in the derivation cohort. Each 3-letter combination (for example, VVI) represents a different parameterization approach described in Scrucca et. al. InflaMix is a VVV model, which means that different means, variances, and covariances can be estimated for each multivariate mixture (cluster) distribution. b-g, Comparing lab measures between inflammatory (n = 39) and noninflammatory (n = 110) clusters in the derivation cohort. Inferences by FDR-corrected Wilcoxon tests for (b) IL-6, (c) CRP, (d) LDH, (e) Hgb, (f) WBC, and (g) Tbili. Boxplots depict the median bounded by the 1st and 3rd quartile values. Boxplot whiskers depict 1.5 times the IQR beyond the boxplot hinges. All tests were 2-sided with a significance level of 0.05. InflaMix cluster assignments viewed through AST and CRP dimensions in the derivation cohort when (h) all 14 lab features are used to generate the model and (i) lab features with lowest variable importance (WBC, Plt, Tbili) by random forest prediction of cluster assignment are removed from model generation. Hgb, hemoglobin; Plt, platelets; Tbili, total bilirubin.
Extended Data Fig. 4
Extended Data Fig. 4. InflaMix reliably estimates cluster assignment probabilities.
InflaMix performance in consistent cluster assignment was benchmarked against mixture model variants derived from bootstrapped populations from the (a-c) derivation cohort (Cohort I) and an (d-f) independent Cluster Assignment Validation (CAV) cohort of patients with NHL. Calibrations by linear regression fits of inflammatory cluster assignment (ICA) probabilities by InflaMix to averaged ICA probabilities conferred by all mixture model variants for a given patient are plotted when InflaMix predictions are made with (a, d) no missing laboratory values, (b, e) up to 7 missing laboratory values (simulated over multiple iterations), and (c, f) only the limited 6-lab InflaMix panel (albumin, Hgb, AST, alkaline phosphatase, LDH, and CRP). 95% confidence intervals are provided for the regression fits. The black lines represent ideal calibration, and the gray shaded boxes overlap with concordant cluster assignments. Both Pearson correlation coefficients and Lin’s CCC, are reported. Intercepts and slopes for the least squares regression line fits, as well as the adjusted Rand indices for cluster assignment agreement are provided in Supplementary Table 1. AST, aspartate aminotransferase; CCC, Concordance correlation coefficient; CRP, C-reactive protein; Hgb, hemoglobin; LDH, lactate dehydrogenase; NHL, non-Hodgkin lymphoma; PCC, Pearson correlation coefficient.
Extended Data Fig. 5
Extended Data Fig. 5. InflaMix cluster assignment identifies similar laboratory profiles across 4 independent cohorts.
Heatmaps of normalized preinfusion laboratory values in (a) the model derivation cohort of patients with LBCL treated at MSK (Cohort I), (b) the MSK LBCL validation cohort (Cohort II), (c) the SMC + HMH LBCL validation cohort (Cohort III), and (d) the MCL and FL validation cohort (Cohort IV; all centers) scaled by distributions of ULN-normalized preinfusion lab values in the model derivation cohort,. Patients (columns) are ordered by probability of cluster assignment. Flanking heatmaps are colored by median scaled lab values in each cluster, including unscaled medians with IQR. Units of measure: albumin, Hgb (g/dL); ALP, AST, LDH (U/L); CRP, Tbili (mg/dL); D-dimer (mcg/mL); ferritin (ng/mL); IL-6, IL-10, TNFα (pg/mL); Plt, WBC (K/mcL). ALP, alkaline phosphatase; FL, follicular lymphoma; g, grams; Hgb, hemoglobin; HMH, John Theurer Cancer Center of Hackensack Meridian Health; K, 1000 cells; mcL, microliter; MCL, mantle cell lymphoma; mg, milligram; MSK, Memorial Sloan Kettering Cancer Center; ng, nanograms; NHL, non-Hodgkin lymphoma; pg, picogram; Plt, platelets; SMC, Sheba Medical Center; Tbili, total bilirubin; U/L, units per liter; ULN, upper limit of normal.
Extended Data Fig. 6
Extended Data Fig. 6. InflaMix-assigned clusters associate with clinical outcomes independently of tumor burden.
Kaplan-Meier survival estimates of PFS and OS, and rates of CR by day 100 by InflaMix clustering across all patients across all patients with LBCL at MSK who had PET radiomic assessments with either high or low tumor burden by MTV. Odds ratios of no CR by day 100 and hazard ratios estimated with 95% CI using regression models adjusted for age, primary refractory disease, and costimulatory domain. Estimates for (a) PFS, (b) OS by day 100, and (c) rates of CR by day 100 in patients with MTV greater than upper tercile MTV value (83.45 mm3); and (d) PFS, (e) OS, (f) rates of CR by day 100 in patients with MTV lower than the upper tercile value. In a Cox proportional hazards regression model adjusted for age, primary refractory disease, costimulatory domain, MTV as a continuous variable, and an interaction term between MTV and inflammatory cluster assignment, inflammatory clustering was still significantly associated with outcomes (Supplementary Table 2). Significance of cluster associations with clinical outcomes was determined by the Wald test. All tests were 2-sided with a significance level of 0.05. Adj. adjusted; CI, confidence interval; CR, complete response; FL, follicular lymphoma; HR, hazard ratio; Infl., Inflammatory Cluster; MTV, metabolic tumor volume; Non-Infl., Non-Inflammatory Cluster; PET, positron emission tomography; PFS, progression-free survival; OR, odds ratio; OS, overall survival; ULN, upper limit of normal.
Extended Data Fig. 7
Extended Data Fig. 7. InflaMix-informed prediction models for PFS at 6 months outperform models trained with conventional biomarkers or alternative mixture models trained without unconventional cytokine measurements.
The InflaMix model uses base clinical features (age, costimulatory domain, primary refractory disease, elevated prelymphodepletion LDH) and InflaMix score (log-transformed cluster assignment probability). Conventional model benchmarks include: Base - base clinical features only, CRP–base clinical features and prelymphodepletion CRP, NoCytoMM–base clinical features and log-transformed probability of inflammatory clustering assigned by an alternative Gaussian mixture model trained without IL-6, IL-10, or TNFα, Lab11Reg–Regularized regression model of base clinical features and all 11 analytes used to develop the alternative Gaussian mixture model. All models were trained using Cox proportional hazards regression. Prediction performance was assessed using an independent validation cohort of patients with LBCL. For each set of model comparisons, the validation cohort was divided into a group used to recalibrate the original model and an independent test group, repeated 100 times with 2-fold cross-validation for an unbiased assessment. InflaMix-informed prediction of PFS at 6 months conferred a significantly improved AUROC (Wald test, p < 0.01) over all alternative models: (InflaMix 0.72, NoCytoMM 0.62, Lab11Reg 0.61 and InflaMix 0.74, NoCytoMM 0.68, CRP 0.67, Base 0.68). Calibration curves, density plots, and net benefit here are evaluated using risk estimates aggregated across all repeated validation folds. A positive event here is defined as disease progression, relapse, or death by 6 months. (a, b) Calibration curves of InflaMix-informed models compared to those of conventionally trained models ((a) Lab11Reg and NoCytoMM (b) Base, NoCytoMM, and CRP) (c, d) Decision curve analyses comparing net benefit conferred by InflaMix-informed models against conventional models ((c) Lab11Reg and NoCytoMM, (d) Base, NoCytoMM, and CRP) in patients who obtain a PR by day +30 after CAR-T infusion. The net benefit is evaluated for consolidation therapies across relatively low (20-30%) and high (30-40%) probability threshold ranges. Auto-HCT, autologous hematopoietic cell transplantation; PFS, progression-free survival; PR, partial response.
Extended Data Fig. 8
Extended Data Fig. 8. InflaMix-assigned clusters associate with clinical outcomes agnostic of CAR-T product used.
Kaplan-Meier survival estimates of PFS and OS, and rates of CR by day 100 by InflaMix clustering across all patients in the study (all cohorts) treated by either CD28- or 41BB-costimulatory domain CAR-T products. Odds ratios of no CR by day 100 and hazard ratios estimated with 95% CI using regression models adjusted for age, primary refractory disease, costimulatory domain, prelymphodepletion LDH elevated above ULN, disease (MCL, FL, or LBCL), and CAR-T product. Estimates for (a) PFS, (b) OS, and (c) rates of CR by day 100 in patients treated with CD28-costimulatory domain products; and (d) PFS, (e) OS, and (f) rates of CR by day 100 in patients treated with 41BB-costimulatory domain products. Significance of cluster associations with clinical outcomes was determined by the Wald test. All tests were 2-sided with a significance level of 0.05. Adj. adjusted; CI, confidence interval; CR, complete response; FL, follicular lymphoma; HR, hazard ratio; Infl., Inflammatory Cluster; MCL, mantle cell lymphoma; Non-Infl., Non-Inflammatory Cluster; PFS, progression-free survival; OR, odds ratio; OS, overall survival; ULN, upper limit of normal.

References

    1. Neelapu, S. S. et al. Axicabtagene ciloleucel CAR T-cell therapy in refractory large B-cell lymphoma. N. Engl. J. Med.377, 2531–2544 (2017). - PMC - PubMed
    1. Schuster, S. J. et al. Tisagenlecleucel in adult relapsed or refractory diffuse large B-cell lymphoma. N. Engl. J. Med.380, 45–56 (2019). - PubMed
    1. Abramson, J. S. et al. Lisocabtagene maraleucel for patients with relapsed or refractory large B-cell lymphomas (TRANSCEND NHL 001): a multicentre seamless design study. Lancet396, 839–852 (2020). - PubMed
    1. Locke, F. L. et al. Long-term safety and activity of axicabtagene ciloleucel in refractory large B-cell lymphoma (ZUMA-1): a single-arm, multicentre, phase 1-2 trial. Lancet Oncol.20, 31–42 (2019). - PMC - PubMed
    1. Locke, F. L. et al. Axicabtagene ciloleucel as second-line therapy for large B-cell lymphoma. N. Engl. J. Med.386, 640–654 (2022). - PubMed

LinkOut - more resources