. 2025 Apr 1;25(1):591.
doi: 10.1186/s12885-025-13984-6.

Integrative analysis of a novel signature incorporating metabolism and stemness-related genes for risk stratification and assessing clinical outcomes and therapeutic responses in lung adenocarcinoma

Affiliations

Integrative analysis of a novel signature incorporating metabolism and stemness-related genes for risk stratification and assessing clinical outcomes and therapeutic responses in lung adenocarcinoma

Wanrong Zheng et al. BMC Cancer. .

Abstract

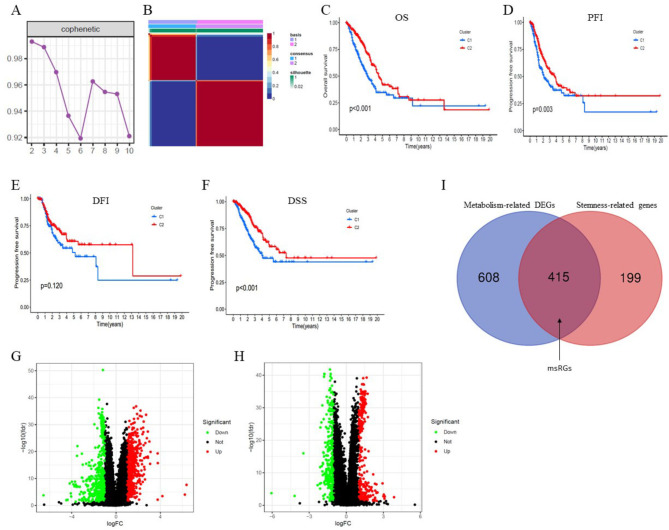
Background: Metabolism and stemness-related genes (msRGs) are critical in the development and progression of lung adenocarcinoma (LUAD). Nevertheless, reliable prognostic risk signatures derived from msRGs have yet to be established.

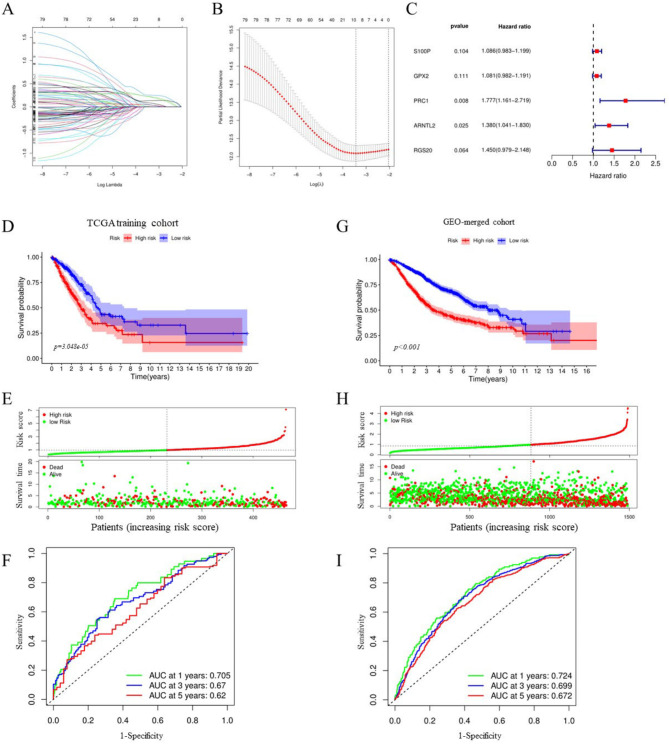
Methods: In this study, we downloaded and analyzed RNA-sequencing and clinical data from The Cancer Genome Atlas (TCGA) and the Gene Expression Omnibus (GEO) databases. We employed univariate and multivariate Cox regression analyses, along with least absolute shrinkage and selection operator (LASSO) regression analysis, to identify msRGs that are linked to the prognosis of LUAD and to develop the prognostic risk signature. The prognostic value was evaluated using Kaplan-Meier analysis and log-rank tests. We generated receiver operating characteristic (ROC) curves to evaluate the predictive capability of the prognostic signature. To estimate the relative proportions of infiltrating immune cells, we utilized the CIBERSORT algorithm and the MCPCOUNTER method. The prediction of the half-maximal inhibitory concentration (IC50) for commonly used chemotherapy drugs was conducted through ridge regression employing the "pRRophetic" R package. The validation of our analytical findings was performed through both in vivo and in vitro studies.

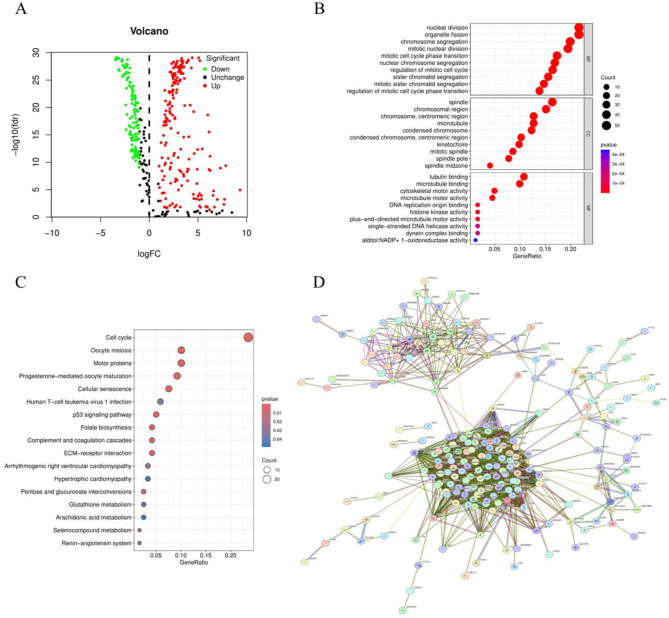
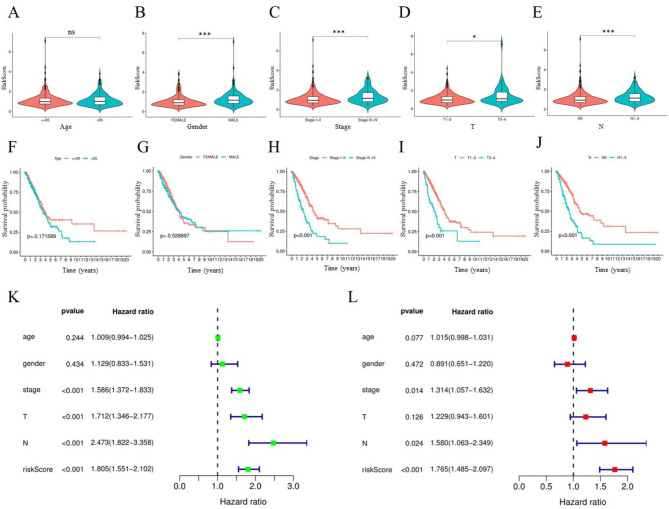
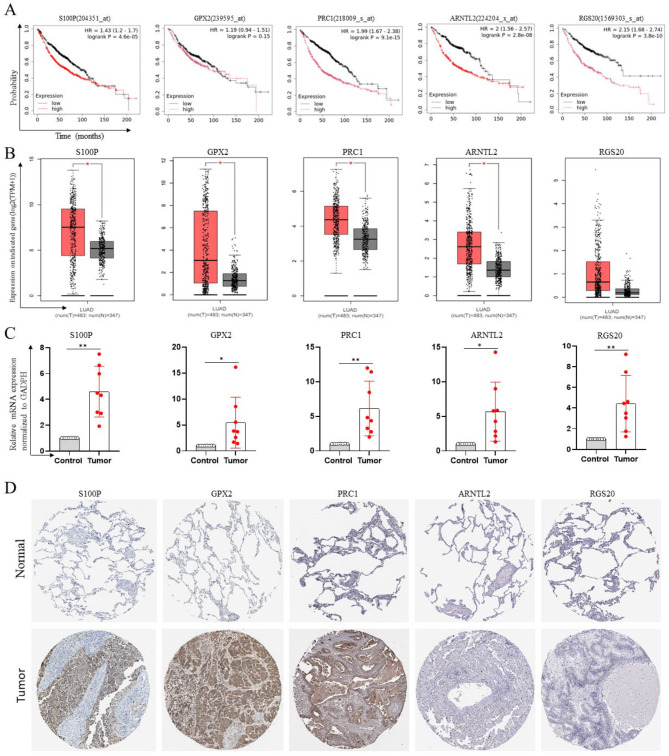
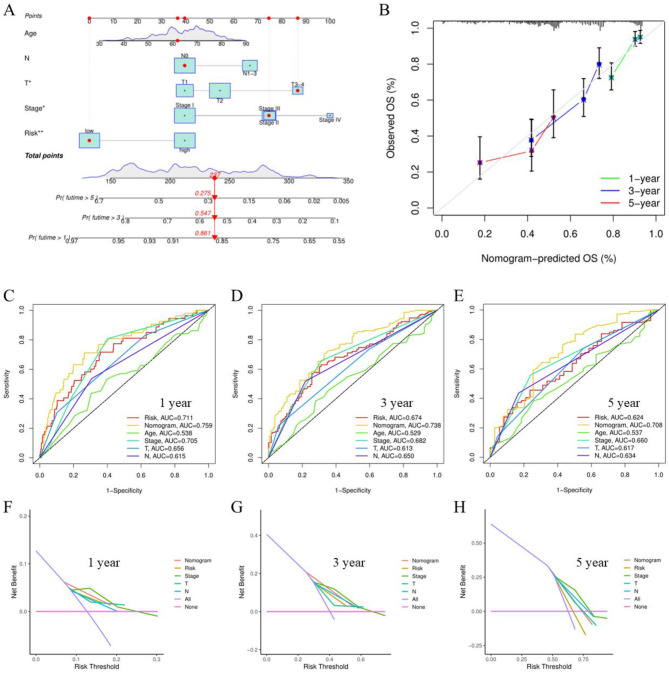
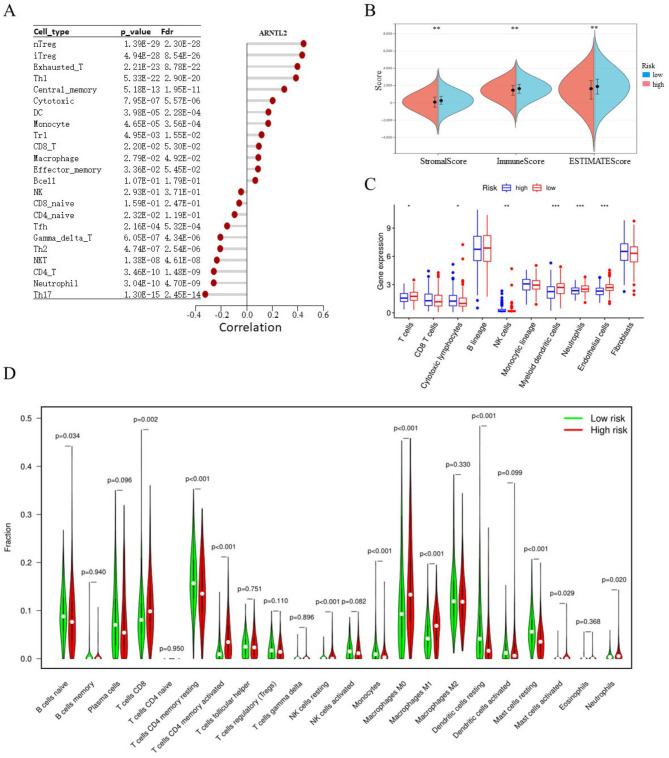
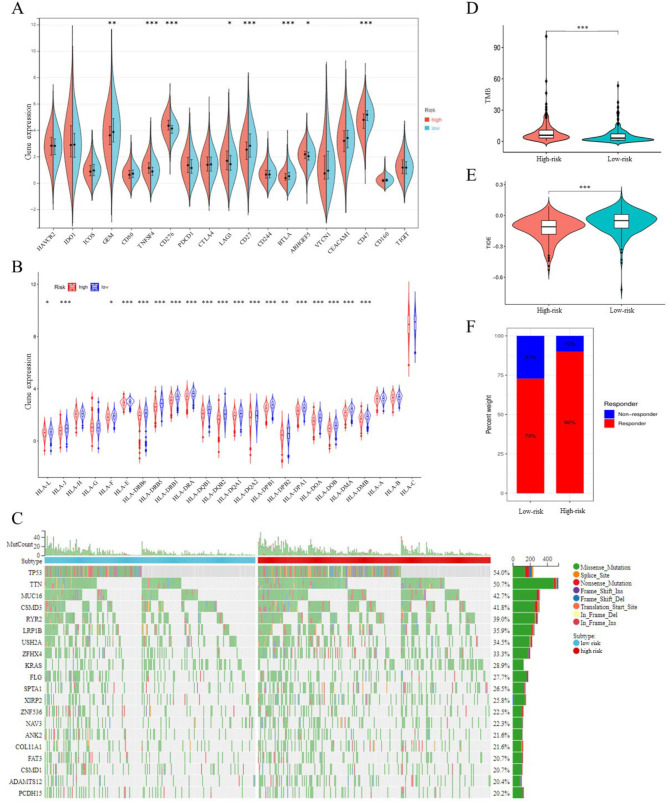
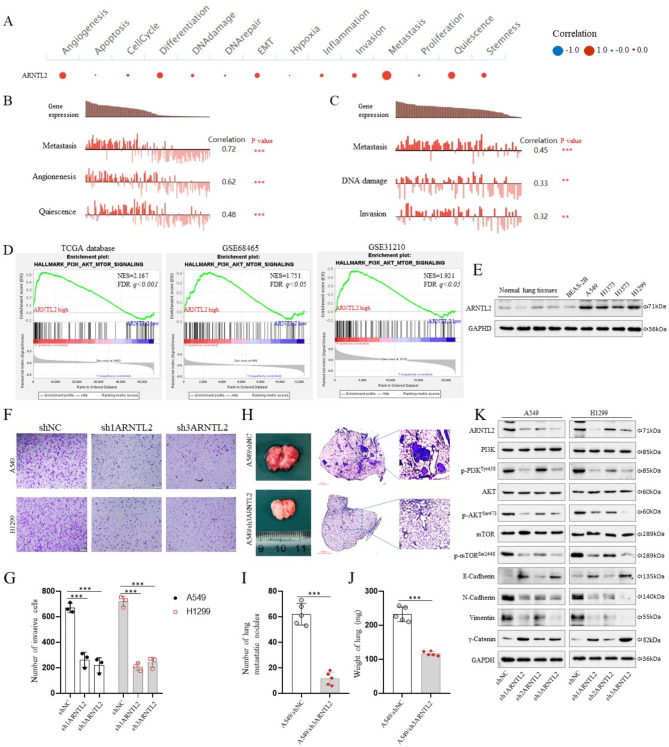
Results: A novel five-gene prognostic risk signature consisting of S100P, GPX2, PRC1, ARNTL2, and RGS20 was developed based on the msRGs. A risk score derived from this gene signature was utilized to stratify LUAD patients into high- and low-risk groups, with the former exhibiting significantly poorer overall survival (OS). A nomogram was constructed incorporating the risk score and other clinical characteristics, showcasing strong capabilities in estimating the OS rates for LUAD patients. Furthermore, we observed notable differences in the infiltration of various immune cell subtypes, as well as in responses to immunotherapy and chemotherapy, between the low-risk and high-risk groups. Results from gene set enrichment analysis (GSEA) and in vitro studies indicated that the prognostic signature gene ARNTL2 influenced the prognosis of LUAD patients, primarily through the activation of the PI3K/AKT/mTOR signaling pathway.

Conclusions: Utilizing this gene signature for risk stratification could help with clinical treatment management and improve the prognosis of LUAD patients.

Keywords: Bioinformatics; Immune infiltration; Lung adenocarcinoma; Metabolism and stemness-related genes signature.


Conflict of interest statement

Declarations. Ethics approval and consent to participate: Our research adheres to the Declaration of Helsinki. The studies involving human participants were reviewed and approved by the Ethics Committee of Medical School of Henan University, China (HUSOM-2018-282). Informed consent was obtained from all subjects involved in the study. The animal study was reviewed and approved by the Ethic Committee of Medical School of Henan University. Consent for publication: Not applicable. Competing interests: The authors declare no competing interests.

Figures

Fig. 1
Fig. 1
Identification of metabolism and stemness-related genes (msRGs). A The cophenetic coefficient for clusters k = 2 to 10 indicates that the most significant cointegration correlation coefficient is observed in cluster k = 2. B The scheme that partitions the samples into two subgroups demonstrates optimal performance in consensus clustering. C-F Kaplan-Meier plots of overall survival (OS) (C), progression-free interval (PFI) (D), disease-free internval (DFI) (E), and disease specific survival (DSS) (F) for the two metabolism subgroups of LUAD patients, as derived from the TCGA database. G, H Volcano plots illustrating the expression of metabolism-related DEGs (E) and stemness-related genes (F) based on the TCGA database. I Venn diagrams depict the overlaps between metabolism-related DEGs and stemness-related genes. DEGs, differentially expressed genes
Fig. 2
Fig. 2
Functional enrichment analysis of metabolism and stemness-related DEGs and the establishment of protein-protein interaction networks. A Volcano plot illustrating the metabolism and stemness-related DEGs. B Representative results from gene ontology (GO) analyses of DEGs sourced from the TCGA database. C Representative analyses of Kyoto Encyclopedia of Genes and Genomes (KEGG) pathways related to DEGs in the TCGA database. D The protein-protein interaction network for metabolism and stemness-related DEGs, constructed using the STRING database. DEGs, differentially expressed genes
Fig. 3
Fig. 3
The metabolism and stemness-related gene signature and prognostic classifier in the LUAD cohort. A LASSO coefficient analysis of the metabolism and stemness-related DEGs is presented. The dotted lines in the graph indicate the values selected through 3-fold cross-validation. B A three-fold cross-validation is performed to determine the tuning parameter in the LASSO model, with partial likelihood deviation values plotted against log(λ), and the error bars representing standard error (SE). C A forest plot displays the hazard ratios for five metabolism and stemness-related prognostic DEGs obtained from multivariate Cox regression analyses. D, G Kaplan-Meier plot analyses are shown for the TCGA cohort (D) and the GEO-merged cohort (G). E, H The risk distribution among patients is depicted in the training cohort (E) and the GEO-merged cohort (H). F, I The ROC curves of the risk signature are illustrated for the training cohort (F) and the GEO-merged cohort (I). DEGs refers to differentially expressed genes
Fig. 4
Fig. 4
The correlation between the prognostic risk signature and clinicopathological characteristics in the TCGA_LUAD cohort. A-E Comparison of the risk score across different subgroups stratified by clinicopathological characteristics, including age (A), gender (B), pathological stage (C), T stage (D), and N stage (E). F-J Kaplan-Meier curves depicting the probability of OS stratified by the same clinicopathological characteristics: age (F), gender (G), pathological stage (H), T stage (I), and N stage (J). K, L Cox regression analyses for univariate (K) and multivariate (L) models, incorporating age, gender, pathological stage, T stage, N stage, and risk score as factors. OS, overall survival; T, tumor size; N, lymph node metastasis; ns, no significance. Statistical significance is indicated as * P < 0.05 and *** P < 0.001
Fig. 5
Fig. 5
The expression patterns of prognostic risk genes and their correlation with OS in patients with LUAD. A The Kaplan-Meier plot depicts the relationship between the expression levels of S100P, GPX2, PRC2, ARNTL2, and RGS20 and OS in LUAD patients. B The expression patterns of S100P, GPX2, PRC2, ARNTL2, and RGS20 in LUAD and normal samples are presented based on data from the GEPIA database. C RT-qPCR analysis of S100P, GPX2, PRC2, ARNTL2, and RGS20 was conducted using matched clinical tissues (n = 8). D Immunohistochemical analysis of S100P, GPX2, PRC2, ARNTL2, and RGS20 was performed on LUAD and normal tissue samples sourced from the Human Protein Atlas (HPA) database. HR, hazard ratio; OS, overall survival; LUAD, lung adenocarcinoma. Statistical significance is indicated as *P < 0.05; **P < 0.01
Fig. 6
Fig. 6
Construction and validation of a nomogram utilizing the TCGA database. A The nomogram developed predicts the probabilities of OS at 1, 3, and 5 years. The red line exemplifies the method for prognostic prediction. B Calibration curves demonstrate the nomogram’s performance in predicting 1-, 3-, and 5-year OS by comparing observed and predicted outcomes. C-E ROC curve analyses assess the predictive efficiency of the nomogram for 1-, 3-, and 5-year OS based on the TCGA database. F-H Decision curve analysis (DCA) is employed to evaluate the model’s effectiveness. OS, overall survival; AUC, area under the curve; ROC, receiver operating characteristic
Fig. 7
Fig. 7
The infiltration of immune cells in high-risk and low-risk groups. A The correlation analysis of the prognostic risk gene ARNTL2 expression and immune cell infiltration was conducted using the GSCA database. B The ESTIMATE algorithm was employed to compare the ESTIMATE score, immune score, and stromal score between the high-risk and low-risk groups. C, D The levels of immune cell infiltration in LUAD patients were compared between high-risk and low-risk groups using the MCPcounter (C) and CEBERSORT (D) algorithms. Statistical significance is indicated as *P < 0.05, **P < 0.01, ***P < 0.001
Fig. 8
Fig. 8
Analysis of immune checkpoints, HLA, TMB, and TIDE. A It illustrates the differences in immune checkpoint gene expression between high- and low-risk groups. B This panel compares the expression levels of HLA members across the two risk groups. C Mutation mapping of LUAD patients highlights the top 20 genes with the highest mutation frequencies, differentiated by risk group. D A comparison of tumor mutation burden (TMB) among distinct risk groups is shown. E, F These panels display the TIDE values and immunotherapy response results for LUAD patients categorized by risk group. HLA, human leukocyte antigen; TMB, tumor mutation burden; TIDE, tumor immune dysfunction and exclusion. Statistical significance is indicated as *P < 0.05, **P < 0.01, ***P < 0.001
Fig. 9
Fig. 9
Functional analysis and validation of ARNTL2. A The correlation of ARNTL2 with functional state in LUAD based on the CancerSEA database is illustrated through an interactive bubble chart. B, C Detailed functional correlations are presented for the LUAD chip (B) and a patient-derived xenograft model (C). D Enrichment analysis was conducted using Gene Set Enrichment Analysis (GSEA) to compare high and low expression levels of ARNTL2 across the TCGA, GSE68465, and GSE31210 databases. E Western blot analysis was performed to assess ARNTL2 protein expression levels in normal lung tissues and the indicated cell lines. F, G A Transwell assay was utilized to evaluate the invasive ability of A549 and H1299 cells following ARNTL2 silencing, with a scale bar of 100 μm. H-J The impact of ARNTL2 silencing on invasion and metastasis in A549 cells was analyzed using a lung metastasis model. The metastatic tumor lesions in each mouse lung were assessed through Hematoxylin and eosin (H&E) staining (H). Representative images of H&E-stained lung sections from mice injected intravenously with the indicated cells are shown (H). The number of lung metastatic nodules (I) and the lung weight of mice (J) in the indicated groups were measured and analyzed. K Western blot analysis was conducted to evaluate the expression levels of the indicated proteins. The target bands are derived from the corresponding region of the original blot images. **p < 0.01, ***p < 0.001

Similar articles

References

    1. Lovly CM. Expanding horizons for treatment of Early-Stage lung cancer. N Engl J Med. 2022;386:2050–1. - PubMed
    1. Henderson LM, Su IH, Rivera MP, Pak J, Chen X, Reuland DS, et al. Prevalence of lung cancer screening in the US, 2022. JAMA Netw Open. 2024;7:e243190. - PMC - PubMed
    1. Wang Q, Tang Z, Li C, Li X, Su C. Evaluating distinct KRAS subtypes as potential biomarkers for immune checkpoint inhibitor efficacy in lung adenocarcinoma. Front Immunol. 2023;14:1297588. - PMC - PubMed
    1. Zavitsanou AM, Pillai R, Hao Y, Wu WL, Bartnicki E, Karakousi T, et al. KEAP1 mutation in lung adenocarcinoma promotes immune evasion and immunotherapy resistance. Cell Rep. 2023;42:113295. - PMC - PubMed
    1. Das A, Rewari S, Kanaujia BK, Deswal SS, Gupta RS. Analytical investigation of a triple surrounding gate germanium source metal–oxide–semiconductor field-effect transistor with step graded channel for biosensing applications. Int J Numer Model Electron Networks Devices Fields 2023; 36.

MeSH terms

Substances

LinkOut - more resources