. 2025 Dec;17(1):2483944.
doi: 10.1080/19420862.2025.2483944. Epub 2025 Apr 1.

Accelerating high-concentration monoclonal antibody development with large-scale viscosity data and ensemble deep learning

Affiliations

Accelerating high-concentration monoclonal antibody development with large-scale viscosity data and ensemble deep learning

Lateefat A Kalejaye et al. MAbs. 2025 Dec.

Abstract

Highly concentrated antibody solutions are necessary for developing subcutaneous injections but often exhibit high viscosities, posing challenges in antibody-drug development, manufacturing, and administration. Previous computational models were only limited to a few dozen data points for training, a bottleneck for generalizability. In this study, we measured the viscosity of a panel of 229 monoclonal antibodies (mAbs) to develop predictive models for high concentration mAb screening. We developed DeepViscosity, consisting of 102 ensemble artificial neural network models to classify low-viscosity (≤20 cP) and high-viscosity (>20 cP) mAbs at 150 mg/mL, using 30 features from a sequence-based DeepSP model. Two independent test sets, comprising 16 and 38 mAbs with known experimental viscosity, were used to assess DeepViscosity's generalizability. The model exhibited an accuracy of 87.5% and 89.5% on both test sets, respectively, surpassing other predictive methods. DeepViscosity will facilitate early-stage antibody development to select low-viscosity antibodies for improved manufacturability and formulation properties, critical for subcutaneous drug delivery. The webserver-based application can be freely accessed via https://devpred.onrender.com/DeepViscosity.

Keywords: Antibody viscosity; ensemble deep learning; high-concentration formulations; monoclonal antibodies.


Conflict of interest statement

AL, MH, CC, AD, GK, VS, MY, MP, MB, JC, AH, MK, MS, AG, and NM are all AstraZeneca employees and may or may not hold AstraZeneca stock. MD was an AstraZeneca employee and may or may not hold AstraZeneca stock and is currently at Xaira Therapeutics and may or may not hold Xaira Therapeutics stock.

Figures

Figure 1.
Figure 1.
a) Experimental viscosity profile of 229 mAbs (DV_mAb_229) used as training and validation data sets in this study. b) Experimental viscosity profile of Lai_mAb_16 used as an independent test set. c) Experimental viscosity profile of Apgar_mAb_38 used as an independent test set. d) Pairwise sequence identity score distribution between DV_mAb_229, 26106 total pairwise combinations (229 × 228/2). e) Pairwise sequence identity score distribution between the DV_mAb_229 versus Lai_mAb_16, 1832 total pairwise combinations (229 × 16/2). f) Pairwise sequence identity score distribution between the DV_mAb_229 versus Apgar_mAb_38, 4351 total pairwise combinations (229 × 38).
This figure presents a comparison of machine learning models using two different feature sets: DeepSP and One-Hot Encoding. Panels A and B show the accuracy of various models, evaluated on the training and two independent test datasets. Panels C and D display the Precision-Recall curves for all models tested on the Lai_mAb_16 test set, highlighting each model’s ability to balance precision and recall using the DeepSP and One-Hot Encoding features, respectively.
Figure 2.
a) Accuracy comparison of all the models using features from DeepSP. b) Accuracy comparison of all the models using features from one-hot encoding. c) Precision-recall curve comparison of all the models on the Lai_mAb_16 test set, using features from DeepSP. d) Precision-recall curve comparison of all the models on Lai_mAb_16 test set, using features from one-hot encoding.
Swarm plots demonstrating the performance of the DeepViscosity prediction model on two independent test sets. The left plot visualizes predictions for the Lai_mAb_16 test set, which has 2 out of 16 misclassifications, resulting in an accuracy of 87.5%. The right plot displays predictions for the Apgar_mAb_38 test set, which has 4 out of 38 misclassifications, resulting in an accuracy of 89.5%. Both plots highlight the DeepViscosity model’s high accuracy and consistent performance across independent datasets.
Figure 3.
Swarm plots of DeepViscosity model on Lai_mAb_16 test set (Accuracy = 87.5%) and Apgar_mAb_38 test set (Accuracy = 89.5%).
Schematic representation of the artificial neural network (ANN) architecture used in the DeepViscosity model. The diagram details the network’s layers, including 102 ensembles of 30 input features, 4 hidden layers with a ‘tanh’ activation function, and an output layer designed to predict mAb viscosity as high or low. This figure provides a structural overview of how the model processes data to achieve its high accuracy in viscosity prediction.
Figure 4.
Illustration of ANN architecture for DeepViscosity model developed in this study.
Swarm plots illustrating the comparative performance of four models -DeepViscosity, developed in this study with three other models: DeepSCM, SHARMA, and TAP from different studies, on two independent test sets. Panel A shows the performance on the Lai_mAb_16 test set, where DeepViscosity has an accuracy of 87.5%, while DeepSCM, SHARMA, and TAP achieve accuracies of 75%, 68.75%, and 56.25%, respectively. Panel B shows the performance on the Apgar_mAb_38 test set, where DeepViscosity and SHARMA achieve 89.5% accuracy, and DeepSCM and TAP achieve 86.8% and 78.9% accuracy, respectively. Both panels provide a visual comparison of the models’ capabilities in predicting mAb viscosity.
Figure 5.
Swarm plots comparing the performance of DeepViscosity, DeepSCM, SHARMA, and TAP models using a) Lai_mAb_16 and b) Apgar_mAb_38, test sets.
Panel A is a scatter plot showing the linear relationship between experimental viscosity values and experimental kD values for mAbs, with two dashed lines marking thresholds: the black dashed line at 20 cP (viscosity cutoff) and the yellow dashed line at -10 mL/g (kD cutoff). Panel B displays a swarm plot using kD as a predictor, visualizing how kD classifies high- and low-viscosity mAbs, with an accuracy of 79%. Panel C provides a classification report comparing experimental viscosity values to the predicted viscosity values based on kD, summarizing performance metrics such as precision, recall, and the overall accuracy of kD as a single predictor of mAb viscosity.
Figure 6.
a) Scatter plot illustrating the linear correlation of experimental viscosity and kD values. (black dashed line represents the 20 cP cutoff for viscosity and the yellow dashed line represents the −10 mL/g cutoff for kD). b) Swarm plot using kD as a predictor. c) Classification report, between experimental viscosity and predicted viscosity from kD.
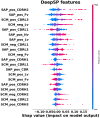
SHAP (SHapley Additive exPlanations) analysis detailing the contribution of DeepSP features to the DeepViscosity model’s predictions. The visualization highlights the relative importance of individual features, indicating their positive or negative influence on predicted viscosity outcomes. Positive SHAP values (red dots predominantly on the right) indicate that a high value of the feature contributes to increased viscosity, whereas negative SHAP values (red dots predominantly on the left) indicate that a high value of the feature contributes to decreased viscosity.
Figure 7.
SHAP analysis of DeepSP features used in the DeepViscosity prediction model.

References

    1. Castelli MS, McGonigle P, Hornby PJ.. The pharmacology and therapeutic applications of monoclonal antibodies. Pharmacol Res & Perspect. 2019;7(6):e0535. doi: 10.1002/prp2.535. - DOI - PMC - PubMed
    1. Corti D, Purcell LA, Snell G, Veesler D.. Tackling COVID-19 with neutralizing monoclonal antibodies. Cell. 2021;184(12):3086–12. doi: 10.1016/j.cell.2021.05.005. - DOI - PMC - PubMed
    1. Wang Z, Wang G, Lu H, Li H, Tang M, Tong A. Development of therapeutic antibodies for the treatment of diseases. Mol Biomed. 2022;3(1):35. doi: 10.1186/s3556-022-00100-4. - DOI - PMC - PubMed
    1. Kaplon H, Crescioli S, Chenoweth A, Visweswaraiah J, Reichert JM. Antibodies to watch in 2023. mAbs. 2023;15(1):23410. doi: 10.1080/10862.2022.23410. - DOI - PMC - PubMed
    1. Elgundi Z, Reslan M, Cruz E, Sifniotis V, Kayser V. The state-of-play and future of antibody therapeutics. Adv Drug Delivery Rev. 2017;122:2–19. doi: 10.1016/j.addr.2016.11.004. - DOI - PubMed

Substances

LinkOut - more resources