

Plasma proteomic profiles correlate with organ dysfunction in COVID-19 ARDS
- PMID: 40170544
- PMCID: PMC11962209
- DOI: 10.14814/phy2.70300
Plasma proteomic profiles correlate with organ dysfunction in COVID-19 ARDS
Abstract
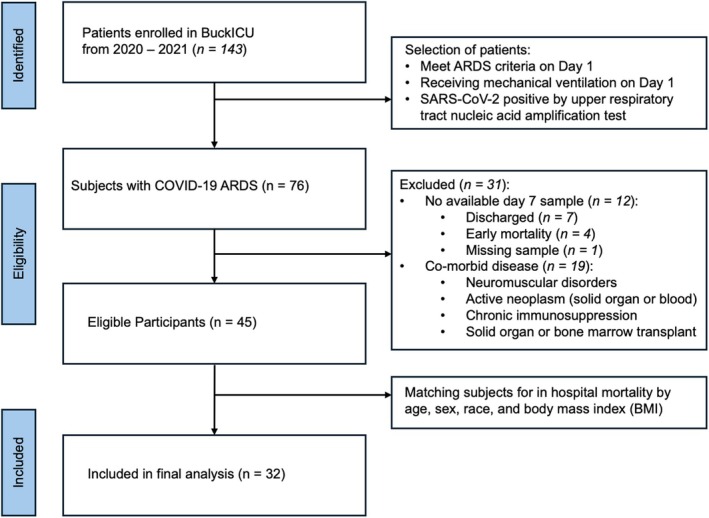
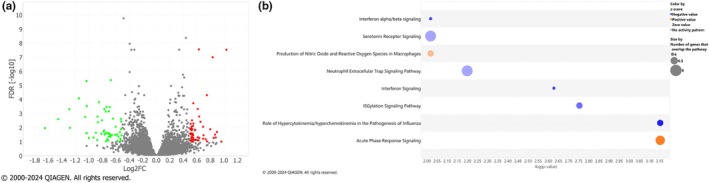
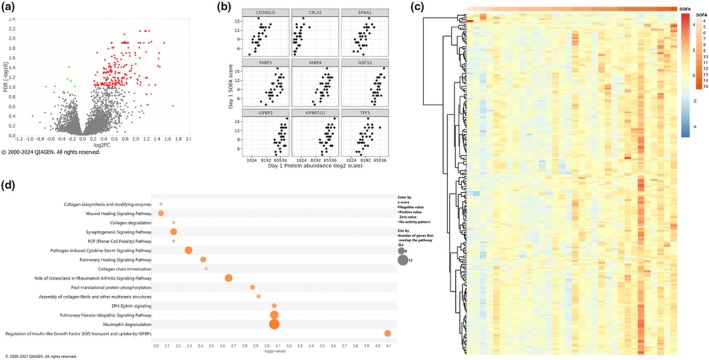
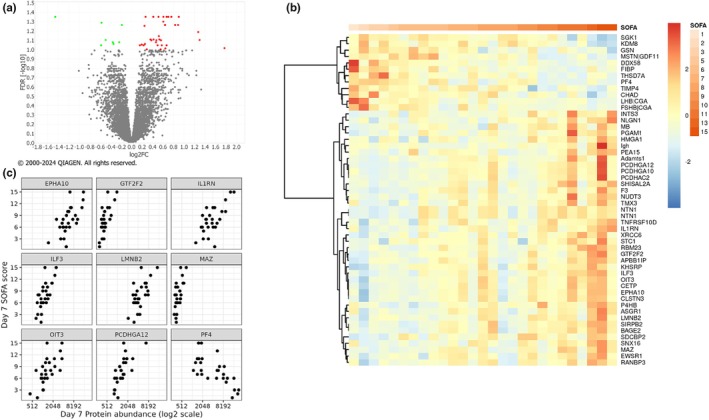
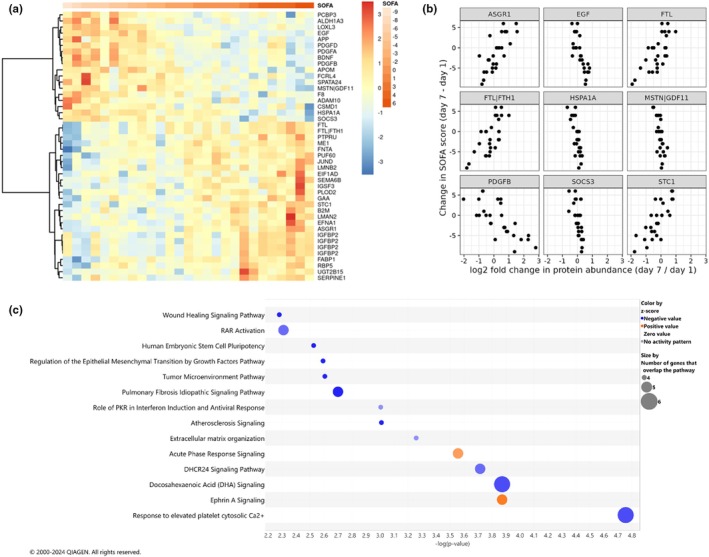
Severe COVID-19 is often complicated by hypoxemic respiratory failure and acute respiratory distress syndrome (ARDS). Mechanisms governing lung injury and repair in ARDS remain poorly understood. We hypothesized that plasma proteomics may uncover protein biomarkers correlated with COVID-19 ARDS severity. We analyzed the plasma proteome from 32 patients with ARDS and COVID-19 using an aptamer-based platform of 7289 proteins, and correlated protein measurements with sequential organ failure assessment (SOFA) scores at days 1 and 7 of ICU admission. We identified 184 differentially abundant proteins correlated with SOFA at day 1 and 46 proteins at day 7. In a longitudinal analysis, we correlated dynamic changes in protein abundance and SOFA between days 1 and 7 and identified 40 significant proteins. Pathway analysis of significant proteins identified increased ephrin signaling and acute phase response signaling correlated with increased SOFA scores between days 1 and 7, while pathways related to pulmonary fibrosis signaling and wound healing had a negative correlation. These findings suggest that persistent inflammation may drive disease severity, while repair processes correlate with improvements in organ dysfunction. This approach is generalizable to future ARDS cohorts for identification of biomarkers and disease mechanisms as we strive towards targeted therapies in ARDS.
Keywords: COVID‐19; SARS‐CoV‐2; acute respiratory distress syndrome; proteomic analysis.
© 2025 The Author(s). Physiological Reports published by Wiley Periodicals LLC on behalf of The Physiological Society and the American Physiological Society.
Conflict of interest statement
The authors declare that the research was conducted without any commercial or financial relationships that could represent conflicts of interest.
Figures
Similar articles
-
Longitudinal transcriptomic analysis reveals persistent enrichment of iron homeostasis and erythrocyte function pathways in severe COVID-19 ARDS.Front Immunol. 2024 Aug 5;15:1397629. doi: 10.3389/fimmu.2024.1397629. eCollection 2024. Front Immunol. 2024. PMID: 39161760 Free PMC article.
-
Increased circulating levels of SP-D and IL-10 are associated with the development of disease severity and pulmonary fibrosis in patients with COVID-19.Front Immunol. 2025 Mar 14;16:1553283. doi: 10.3389/fimmu.2025.1553283. eCollection 2025. Front Immunol. 2025. PMID: 40160824 Free PMC article.
-
Transpulmonary pressure measurements and lung mechanics in patients with early ARDS and SARS-CoV-2.J Crit Care. 2021 Jun;63:106-112. doi: 10.1016/j.jcrc.2021.02.005. Epub 2021 Feb 25. J Crit Care. 2021. PMID: 33676795 Free PMC article.
-
Mass Spectrometry-based Proteomics in Acute Respiratory Distress Syndrome: A Powerful Modality for Pulmonary Precision Medicine.Chin Med J (Engl). 2016 Oct 5;129(19):2357-64. doi: 10.4103/0366-6999.190669. Chin Med J (Engl). 2016. PMID: 27647196 Free PMC article. Review.
-
Commonalities Between ARDS, Pulmonary Fibrosis and COVID-19: The Potential of Autotaxin as a Therapeutic Target.Front Immunol. 2021 Oct 4;12:687397. doi: 10.3389/fimmu.2021.687397. eCollection 2021. Front Immunol. 2021. PMID: 34671341 Free PMC article. Review.
References
-
- Abers, M. S. , Delmonte, O. M. , Ricotta, E. E. , Fintzi, J. , Fink, D. L. , de Jesus, A. A. A. , Zarember, K. A. , Alehashemi, S. , Oikonomou, V. , Desai, J. V. , Canna, S. W. , Shakoory, B. , Dobbs, K. , Imberti, L. , Sottini, A. , Quiros‐Roldan, E. , Castelli, F. , Rossi, C. , Brugnoni, D. , … Notarangelo, L. D. (2021). An immune‐based biomarker signature is associated with mortality in COVID‐19 patients. JCI Insight, 6(1), e144455. 10.1172/jci.insight.144455 - DOI - PMC - PubMed
-
- Archambault, A.‐S. , Zaid, Y. , Rakotoarivelo, V. , Turcotte, C. , Doré, É. , Dubuc, I. , Martin, C. , Flamand, O. , Amar, Y. , Cheikh, A. , Fares, H. , El Hassani, A. , Tijani, Y. , Côté, A. , Laviolette, M. , Boilard, É. , Flamand, L. , & Flamand, N. (2021). High levels of eicosanoids and docosanoids in the lungs of intubated COVID‐19 patients. The FASEB Journal, 35, e21666. - PMC - PubMed
-
- Babačić, H. , Christ, W. , Araújo, J. E. , Mermelekas, G. , Sharma, N. , Tynell, J. , García, M. , Varnaite, R. , Asgeirsson, H. , Glans, H. , Lehtiö, J. , Gredmark‐Russ, S. , Klingström, J. , & Pernemalm, M. (2023). Comprehensive proteomics and meta‐analysis of COVID‐19 host response. Nature Communications, 14, 5921. - PMC - PubMed
-
- Baindara, P. , Sarker, M. B. , Earhart, A. P. , Mandal, S. M. , & Schrum, A. G. (2022). NOTCH signaling in COVID‐19: A central hub controlling genes, proteins, and cells that mediate SARS‐CoV‐2 entry, the inflammatory response, and lung regeneration. Frontiers in Cellular and Infection Microbiology, 12, 928704. - PMC - PubMed
-
- Batra, R. , Whalen, W. , Alvarez‐Mulett, S. , Gomez‐Escobar, L. G. , Hoffman, K. L. , Simmons, W. , Harrington, J. , Chetnik, K. , Buyukozkan, M. , Benedetti, E. , Choi, M. E. , Suhre, K. , Schenck, E. , Choi, A. M. K. , Schmidt, F. , Cho, S. J. , & Krumsiek, J. (2022). Multi‐omic comparative analysis of COVID‐19 and bacterial sepsis‐induced ARDS. PLoS Pathogens, 18, e1010819. - PMC - PubMed
MeSH terms
Substances
Grants and funding
- K08HL169725/HHS | NIH | National Heart, Lung, and Blood Institute (NHLBI)
- R01HL142767/HHS | NIH | National Heart, Lung, and Blood Institute (NHLBI)
- R01HL141195/HHS | NIH | National Heart, Lung, and Blood Institute (NHLBI)
- P01HL114453/HHS | NIH | National Heart, Lung, and Blood Institute (NHLBI)
- R01HL097376/HHS | NIH | National Heart, Lung, and Blood Institute (NHLBI)
- R01HL081784/HHS | NIH | National Heart, Lung, and Blood Institute (NHLBI)
- R01HL096376/HHS | NIH | National Heart, Lung, and Blood Institute (NHLBI)
- UM1TR004548/HHS | NIH | National Center for Advancing Translational Sciences (NCATS)
- OSU | College of Medicine Office of Research, Ohio State University (COMOR)
LinkOut - more resources
Full Text Sources
Medical
Miscellaneous
