

Catch Data Can Unravel Elasmobranch Aggregation Dynamics and Group Behaviours
- PMID: 40170810
- PMCID: PMC11955303
- DOI: 10.1002/ece3.71107
Catch Data Can Unravel Elasmobranch Aggregation Dynamics and Group Behaviours
Abstract
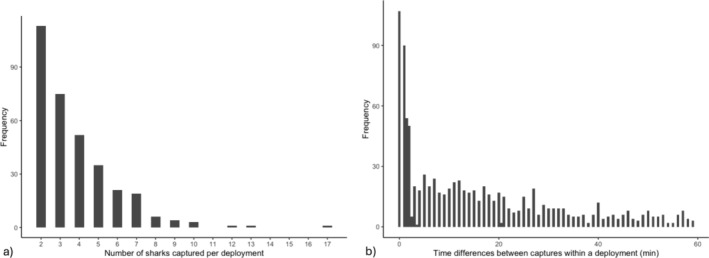
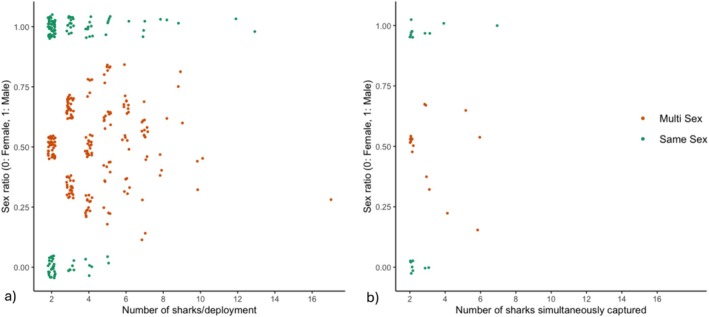
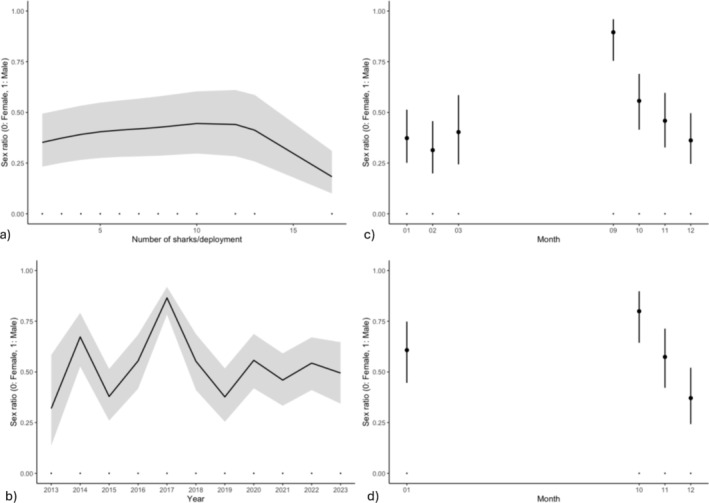
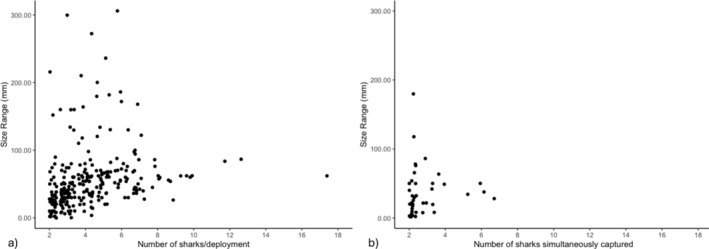
Elasmobranchs (i.e., sharks, skates, rays), known for their cognitive abilities and complex behaviours, often form aggregations that are thought to be crucial for their survival and evolutionary success. However, understanding the drivers behind these aggregations remains challenging due to the dynamism of the marine environment and the difficulty of observing these species directly. Here, we aim to address these challenges by introducing a methodological framework for analysing catch data to infer aggregation behaviour. Within this framework, we outline key metrics to explore, such as the number and density of individuals captured, phenotypic traits, drivers of co-occurrence, individual identification, and kin structure. We then demonstrate how to use this framework in a case study of juvenile blacktip reef sharks (Carcharhinus melanopterus) in Moorea, French Polynesia, to determine its real-world application and identify potential limitations. Our results reveal that juvenile blacktip reef sharks around Moorea tend to aggregate during early life stages and that these aggregations appear non-social, indicative of environmental rather than social drivers. We also find that, while catch data can provide valuable insights into elasmobranch aggregations, they must be complemented with targeted research methods to maximise the available data advised within our framework. As findings from our case study demonstrate, this framework has the capacity to broaden our knowledge of elasmobranch aggregations and social behaviours, underscoring the importance of dedicated efforts in research and conservation to manage these vulnerable species effectively.
Keywords: animal behaviour; fisheries; interactions; marine conservation; sociality.
© 2025 The Author(s). Ecology and Evolution published by John Wiley & Sons Ltd.
Conflict of interest statement
The authors declare no conflicts of interest.
Figures
Similar articles
-
Spatial and temporal analysis of juvenile blacktip reef shark (Carcharhinus melanopterus) demographies identifies critical habitats.J Fish Biol. 2024 Jan;104(1):92-103. doi: 10.1111/jfb.15569. Epub 2023 Sep 29. J Fish Biol. 2024. PMID: 37726231
-
Using unmanned aerial vehicle (UAV) surveys and image analysis in the study of large surface-associated marine species: a case study on reef sharks Carcharhinus melanopterus shoaling behaviour.J Fish Biol. 2018 Jul;93(1):119-127. doi: 10.1111/jfb.13645. J Fish Biol. 2018. PMID: 29855056
-
Species co-occurrence affects the trophic interactions of two juvenile reef shark species in tropical lagoon nurseries in Moorea (French Polynesia).Mar Environ Res. 2017 Jun;127:84-91. doi: 10.1016/j.marenvres.2017.03.010. Epub 2017 Mar 28. Mar Environ Res. 2017. PMID: 28400049
-
The vulnerability of sharks, skates, and rays to ocean deoxygenation: Physiological mechanisms, behavioral responses, and ecological impacts.J Fish Biol. 2024 Aug;105(2):482-511. doi: 10.1111/jfb.15830. Epub 2024 Jun 9. J Fish Biol. 2024. PMID: 38852616 Review.
-
Ecological risk assessment and its application to elasmobranch conservation and management.J Fish Biol. 2012 Apr;80(5):1727-48. doi: 10.1111/j.1095-8649.2012.03235.x. Epub 2012 Mar 9. J Fish Biol. 2012. PMID: 22497405 Review.
References
-
- Allee, W. C. 1927. “Animal Aggregations.” Quarterly Review of Biology 2, no. 3: 367–398. 10.1086/394281. - DOI
-
- Anderson, S. D. , Chapple T. K., Jorgensen S. J., Klimley A. P., and Block B. A.. 2011. “Long‐Term Individual Identification and Site Fidelity of White Sharks, Carcharodon carcharias , off California Using Dorsal Fins.” Marine Biology 158, no. 6: 1233–1237. 10.1007/s00227-011-1643-5. - DOI - PMC - PubMed
Associated data
LinkOut - more resources
Full Text Sources
Research Materials
