. 2025 Mar 27;15(4):e70975.
doi: 10.1002/ece3.70975. eCollection 2025 Apr.

A LEAP Forward in Wildlife Conservation: A Standardized Framework to Determine Mortality Causes in Large GPS-Tagged Birds

Connor T Panter  1   2 Carina Nebel  3   4 Maximilian Raab  5   6 Verena Strauss  5   7 Clara Freytag  5 Manuel Wojta  5 Hannah Böing  5 Patrick Hacker  5 Rainhard Raab  5 Jendrik Windt  8 Annika Posautz  7 Anna Kuebber-Heiss  7 Patrick Scherler  9 Martin U Grüebler  9 Urs G Kormann  9 Martin Kolbe  10 Alexandre Millon  11 Javier de la Puente  12 Javier Viñuela  13 Duncan Orr-Ewing  14 Oliver Krone  15 Torsten Langgemach  16 Susanne Åkesson  17 Brady Mattsson  8 Petra Sumasgutner  18 Manuel Alcántara de la Fuente  19 Ernesto Alvarez  20 Juan Arizaga  21 Albert Bach Pagès  9   22   23 Ana Bermejo  12 Guido Ceccolini  24 Nayden Chakarov  25   26 Peter Derpmann-Hagenström  27 Marek Dostál  28 Gerd Fabian  29 Wolfgang Fiedler  30 Manuel Galán  20 Clément Ganier  31 Andreas Gärtner  5 Liza Glesener  32 Alfonso Godino  33 Zuzana Guziová  34 László Haraszthy  35 Caka Karlsson  17 Katharina Klein  36 Ivan Literák  28 Nicolas Lorenzini  37 Manuela Löwold  38 Christopher Lüning  39 Boris Maderič  34 Karel Makoň  40 Kerstin Mammen  41   42 Ubbo Mammen  41   42 Torsten Marczak  43 Hynek Matušík  44 Aymeric Mionnet  45 Sara Morollón  46 Jakub Mráz  47 Winfried Nachtigall  48 Bernd Nicolai  10 Marta Olalde Fernández  49 Meinolf Ottensmann  25   50 María Jesús Palacios González  51 Jean-Yves Paquet  52 Vladimír Pečeňák  34 Lubomír Peške  53 Thomas Pfeiffer  54 Robert Pudwill  55 Dušan Rak  56 Tim Maximilian Rapp  25 Alexander Resetaritz  41 Stef van Rijn  57 Romain Riols  58 Arturo Rodríguez  59 Luisa Scholze  5 Laura Schulte  60 Aurélie de Seynes  61 Jan Škrábal  5   28 Péter Spakovszky  5 Eike Steinborn  10 Ján Svetlík  5 Samuel Talhoet  62 Miklós Vaczi  63 Anne-Gaelle Verdier  31 Zdenĕk Vermouzek  64 Diego Villanúa Inglada  65 Jörg Westphal  66 Rainer Raab  5
Affiliations

A LEAP Forward in Wildlife Conservation: A Standardized Framework to Determine Mortality Causes in Large GPS-Tagged Birds

Connor T Panter et al. Ecol Evol. .

Abstract

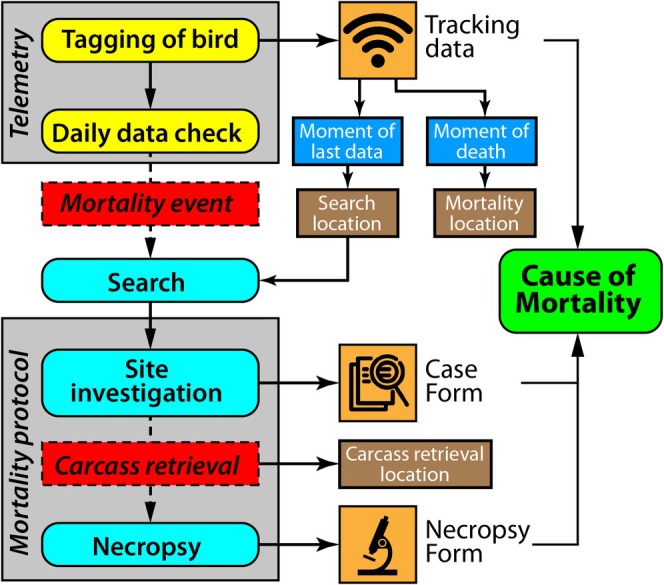
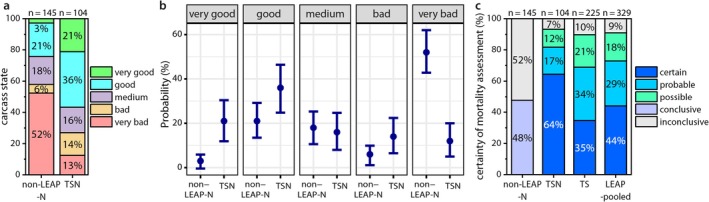
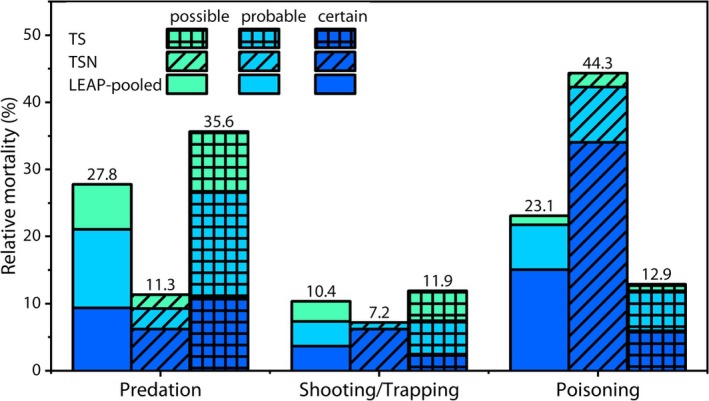
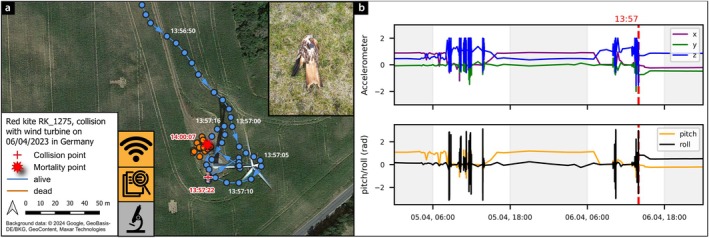
Anthropogenic activities threaten many wildlife populations by increasing mortality rates, making it crucial to identify the locations and causes of mortality to inform conservation actions. Technological advancements, such as GPS satellite tracking, enable precise recording of wildlife movements. High-resolution data from such devices can facilitate rapid carcass recovery and provide insights into the mortality causes of tagged individuals. Obtaining required information to determine these causes is complex, and standardized approaches can overcome these limitations. In this study, we introduce the LIFE EUROKITE Assessment Protocol (LEAP), a framework for determining the timing, locations, and causes of mortality in GPS-tagged birds. LEAP is a multifaceted approach that integrates: (1) GPS tracking data, (2) evidence from the mortality location (site investigation), and (3) necropsy results to derive the mortality cause and a corresponding certainty score. We supplement the detailed description of LEAP with case studies assessing its effectiveness. Using 329 deceased GPS-tagged red kites (Milvus milvus) we compared conditions of the carcasses processed using LEAP with 145 opportunistically collected raptor carcasses. We also show that LEAP improves carcass condition and therefore allows for higher quality necropsy results. Additionally, we assessed how availability among sources of information (tracking, site investigation and necropsy) influences the quality of mortality assessments. Applying LEAP with all data sources provided the highest quality assessments in 64% of cases. Some 35% of cases were of high quality without necropsy, instead drawing evidence only from tracking data and site investigations. Predation related mortality was less prevalent (11%) when relying on necropsy compared to cases without necropsy (36%), while poisoning showed the opposite trend. Furthermore, we provide guidelines and empirical examples of mortality assessments. Our standardized LEAP approach ensures the best use of all available information regarding mortality events in GPS-tagged birds and advances wildlife mortality research as a valuable tool for conservationists and wildlife managers.

Keywords: GPS tracking; bird crime; cause of death; human‐wildlife conflict; population monitoring; survival analysis; wildlife conservation.


Conflict of interest statement

This publication was produced as part of the LIFE EUROKITE project, which is funded by the European Commission's LIFE Nature program (60%), grid operators (15.8%), nature conservation NGOs (9.2%), authorities (8.8%) and renewable energy companies (6.2%). The LIFE EUROKITE project is based on an international cooperation of scientists, NGOs, governmental authorities, and companies, representing diverse backgrounds and contributing to this study in different ways. Based on the legal setup of the LIFE project, co‐financers only provide funding but have no say in the content of scientific contributions. Prof. Dr. Martin Bergmann, who works for iTerra energy GmbH, conducted a mandated quality assurance review to ensure scientific standards. Financial contributors from private companies and NGOs were largely responsible for tagging birds and providing data to the project, while data evaluation, interpretation, and writing of the manuscript were performed by authors working for independent research institutions and universities.

Figures

FIGURE 1
FIGURE 1
Schematic representation of the process to determine the cause of mortality of GPS‐tagged red kites (Milvus milvus) as part of the LIFE EUROKITE assessment protocol (LEAP): Data collection starts with tagging the bird, followed by daily data checks for signs of mortality. If a mortality event occurs, tracking data provides an accurate moment and location of death. This triggers searching for a fresh carcass quickly, with the search location determined from the last known tracking data point. A fresh carcass provides a better chance of carrying out a successful necropsy evaluation. The mortality cause is determined based on three sources: (1) tracking data, (2) observations during the site investigation (documented in the Case Form) and (3) necropsy results (documented in the Necropsy Form). The coloring reflects the following categories: Yellow—GPS tracking; red—event related to the focal carcass; cyan—performed actions during the investigation; orange—information sources for the assessment; blue—point in time; brown—location; green—result of assessment.
FIGURE 2
FIGURE 2
Tracking metadata from red kite (Milvus milvus) RK_2159 (road collision victim): The four plots show the recorded tracking metadata between October 25 at 12:00 and October 29 at 12:00, transmitted once every 5 h. Gray shaded areas represent nighttime, white shaded areas daytime. The moment of mortality is marked with a red, dashed vertical line on the morning of October 28 at 8:45.
FIGURE 3
FIGURE 3
Comparison of 145 opportunistically collected raptor carcasses (non‐LEAP‐N) and 329 post‐fledging red kite (Milvus milvus) carcasses collected and assessed using TSN. (a) Comparison of the carcass conditions (classified as “very good”, “good”, “medium”, “bad”, and “very bad”). (b) Modeled effects, with 95% confidence intervals, of process on carcass condition for 104 kite carcasses of TSN and 145 carcasses of non‐LEAP‐N. (c) Comparison of the certainty assigned to each mortality assessment based on information sources tracking (T), site investigations (S) and necropsy (N). The certainty classes are conclusive and inconclusive for non‐LEAP‐N, for kites analyzed within the LEAP framework, conclusive is split by certain, probable, and possible.
FIGURE 4
FIGURE 4
Causes of mortality for red kites (Milvus milvus). Left: LEAP‐pooled (n = 299, solid colors), including all cases analyzed using LEAP, middle; TSN (with all three sources of data, including necropsy, n = 97, hashed), right; TS (without necropsy, n = 202, gridded). The colors indicate the certainty of the assessment, the numbers above the bars show the combined percentage of relative mortality.
FIGURE B1
FIGURE B1
Exemplary case studies of mortality analyses from tracking data of two red kites (Milvus milvus) of the LIFE EUROKITE project. The maps show the GPS locations before death (blue—alive; orange—dead), with points being connected with arrows to depict movement. The location of mortality is shown with a red star (“mortality point”). The icons in the bottom left box symbolize the availability of the information sources including: Tracking data (Wi‐Fi symbol), site investigation (documents with magnifying glass) and necropsy (microscope; orange—yes; gray—no): (a) tracking of RK_2028's collision with a vehicle, (b) metadata of the interrex transmitter, showing overall dynamic body acceleration (ODBA), a sum of parameters from the accelerometer data, and temperature. (c) Tracking RK_0167's collision with a train, (d) accelerometer (top) and pitch/roll data (bottom). All times are given in UTC.
FIGURE B2
FIGURE B2
Exemplary cases of mortality analyses from tracking data of two red kites (Milvus milvus) from the LIFE EUROKITE project that died through predation. The maps show the GPS locations before death (blue—alive; orange—dead), with points being connected with arrows to depict movement (blue—alive, orange—movements of the carcass by the predator or scavengers after death. The mortality location is shown with a red star (“mortality point”). The icons in the bottom‐left box indicate information sources for mortality assessment: Tracking data (wi‐fi symbol), site investigation (documents with magnifying glass) and necropsy (microscope; orange—yes; gray—no): (a) tracking of RK_1279, (b) Transmitter metadata of RK_1279: Top plots show accelerometer data, bottom plots the pitch/roll data. The moment of mortality is marked with a red, dashed vertical line. (c) tracking of RK_1442, (d) transmitter metadata of RK_1442. All times are given in UTC.
FIGURE B3
FIGURE B3
Exemplary case studies of mortality analyses from tracking data for two red kites (Milvus milvus) from the LIFE EUROKITE project that died by illegal shooting. The maps show the GPS locations before mortality occurred (blue—alive; orange—dead), with points being connected with arrows to depict movement (blue—alive, orange—movements after death) of the carcass by the predator or scavengers. The mortality location is shown with a red star (“mortality point”). The icons symbolize the availability of the information sources including: tracking data (Wi‐Fi symbol), site investigation (documents with magnifying glass) and necropsy (microscope; orange—yes; gray—no): (a) tracking of RK_0349, (b) transmitter metadata of RK_0349: Top plots show accelerometer, bottom plots the pitch/roll data. The moment of mortality is marked with a red, dashed vertical line. (c) Tracking of RK_0458, (d) transmitter metadata of RK_0458, same as (b). All times are given in UTC.
FIGURE B4
FIGURE B4
Exemplary case study of poisoning victim RK_1912: (a) tracking locations of RK_1912 (blue—alive; orange—dead), with points being connected with arrows to depict movement. The mortality location is shown with a red star (“mortality point”). Time of some GPS locations are shown. The icons symbolize the availability of the information sources including tracking data, site investigation and necropsy (orange—yes; gray—no). (b) Photo of the carcass as found in the field; (c) black microgranules suggesting Aldicarb in the digestive contents. (d) High‐performance liquid chromatography coupled with mass spectrometry (HPLC‐MS/MS) chromatograms identifying carbofuran. All times are given in UTC.
FIGURE B5
FIGURE B5
Exemplary case study of wind turbine collision victim RK_1275: (a) tracking locations (one‐data‐point‐per‐second resolution, blue—alive; orange—dead), with points being connected with arrows to depict movement. The mortality location is shown with a red star (“mortality point”). Time of representative GPS locations are shown. The icons symbolize the availability of the information sources including tracking data, site investigation and necropsy (orange—yes; gray—no). The inset shows the carcass of the kite as found by site investigators at the mortality location; (b) accelerometer (top) and pitch/roll data (bottom). All times are given in UTC.

Similar articles

References

    1. Baert, J. M. , Stienen E. W., Heylen B. C., et al. 2018. “High‐Resolution GPS Tracking Reveals Sex Differences in Migratory Behaviour and Stopover Habitat Use in the Lesser Black‐Backed Gull Larus Fuscus .” Scientific Reports 8: 5391. - PMC - PubMed
    1. Balmori, A. 2019. “Endangered Bird Mortality by Gunshots: Still a Current Problem.” Biodiversity and Conservation 28: 2555–2564.
    1. Bellan, S. E. , Gimenez O., Choquet R., and Getz W. M.. 2013. “A Hierarchical Distance Sampling Approach to Estimating Mortality Rates From Opportunistic Carcass Surveillance Data.” Methods in Ecology and Evolution 4: 361–369. - PMC - PubMed
    1. Bergen, S. , Huso M. M., Duerr A. E., et al. 2022. “Classifying Behavior From Short‐Interval Biologging Data: An Example With GPS Tracking of Birds.” Ecology and Evolution 12: e08395. - PMC - PubMed
    1. Brochet, A. L. , Van den Bossche W., Jbour S., et al. 2016. “Preliminary Assessment of the Scope and Scale of Illegal Killing and Taking of Birds in the Mediterranean.” Bird Conservation International 26: 1–28.

LinkOut - more resources