. 2025 Jun;12(22):e2417469.
doi: 10.1002/advs.202417469. Epub 2025 Apr 2.

Inhalable Polymeric Nanoparticle Containing Triphenylphosphanium Bromide-modified Sonosensitizer for Enhanced Therapy of Acute Bacterial Pneumonia

Affiliations

Inhalable Polymeric Nanoparticle Containing Triphenylphosphanium Bromide-modified Sonosensitizer for Enhanced Therapy of Acute Bacterial Pneumonia

Lin Wang et al. Adv Sci (Weinh). 2025 Jun.

Abstract

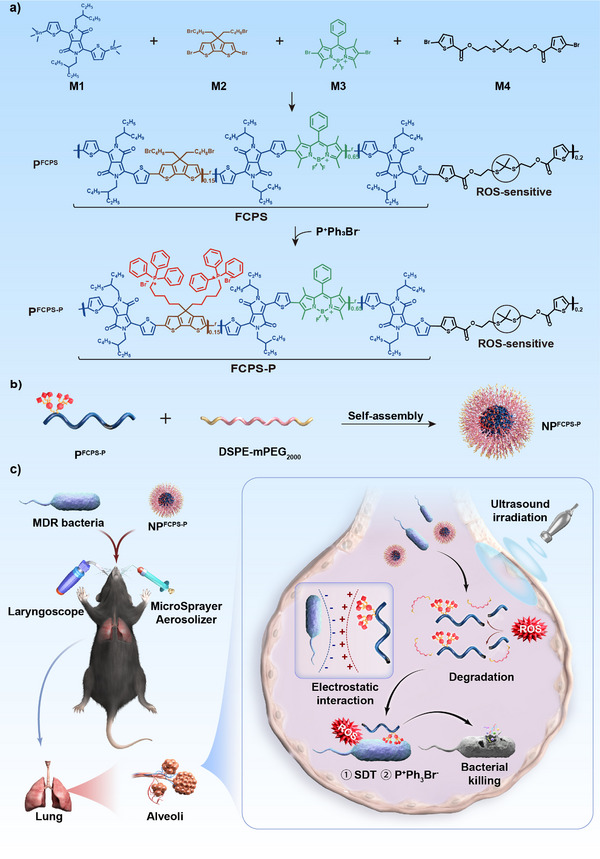
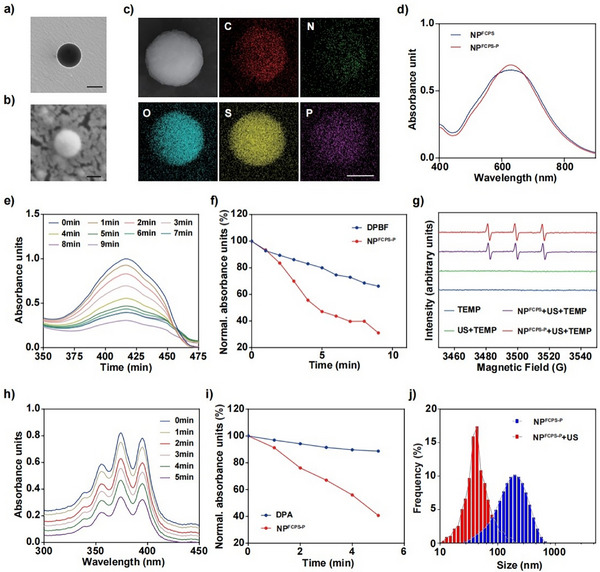
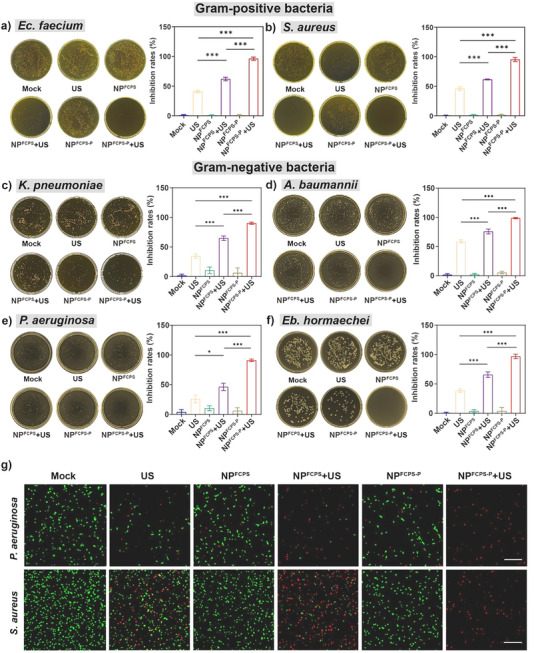
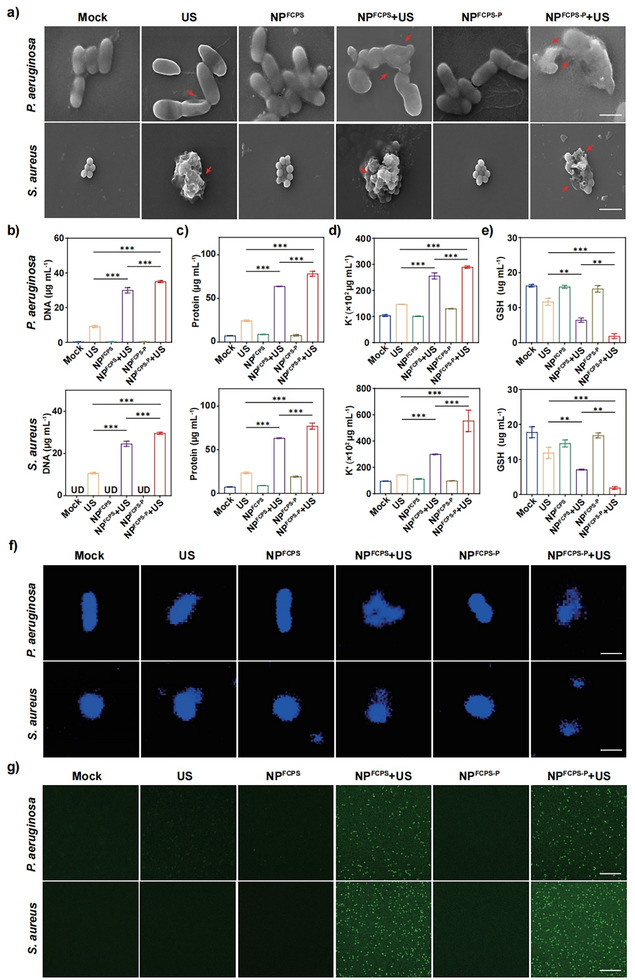
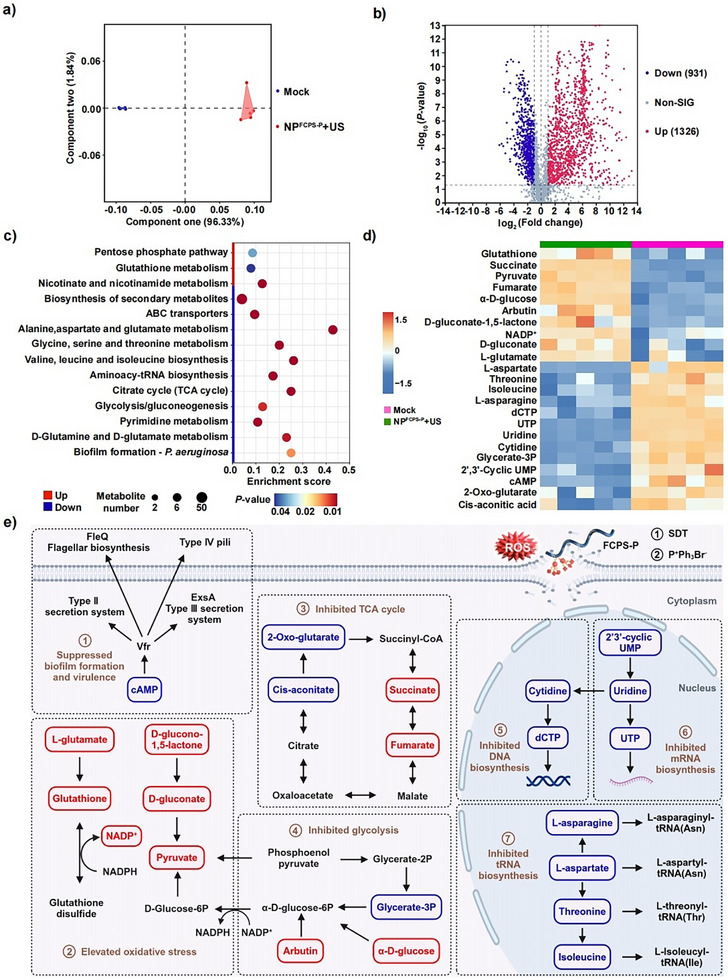
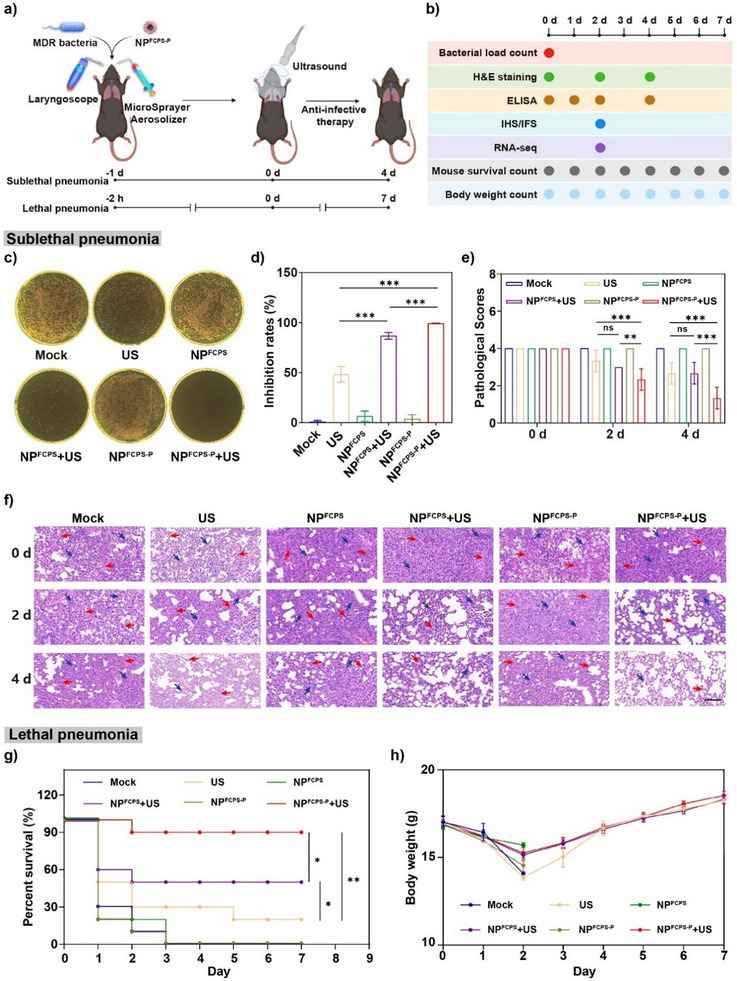
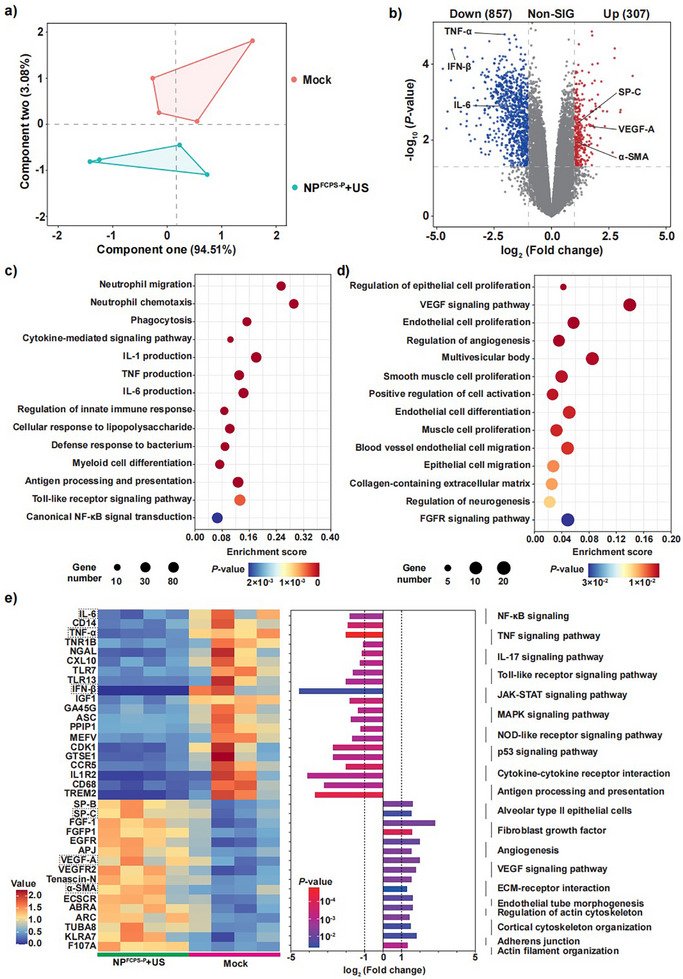
Sonodynamic therapy (SDT) has good feasibility to deeply seated infections, but SDT alone is insufficient being highly effective against multidrug-resistant (MDR) bacteria. SDT combined with triphenylphosphanium bromide (P+Ph3Br-) is expected to solve this problem. This work develops a pseudo-conjugated polymer PFCPS-P containing cationic P+Ph3Br--modified sonosensitizer FCPS (FCPS-P) and ROS-sensitive thioketal bonds. PFCPS-P is assembled with DSPE-mPEG2000 to generate nanoparticle NPFCPS-P. FCPS has SDT effect and generates ROS under ultrasound (US) stimulation. ROS triggers the degradation of NPFCPS-P and release of FCPS-P, endowing highly favored biosafety. FCPS-P targets to bacterial surface through electrostatic interaction and achieves bacterial killing under a synergistic action of SDT and P+Ph3Br-. In vitro, NPFCPS-P+US gives >90% inhibition rates against MDR ESKAPE pathogens, moreover, it causes bacterial metabolic disorders including inhibited nucleic acid synthesis, disordered energy metabolism, excessive oxidative stress, and suppressed biofilm formation and virulence. In mice, NPFCPS-P+US exhibits a 99.3% bactericidal rate in Pseudomonas aeruginosa-induced sublethal pneumonia and renders a 90% animal survival rate in lethal pneumonia, and additionally immunological staining and transcriptomics analyses reveal that NPFCPS-P+US induces inhibited inflammatory response and accelerated lung injury repair. Taken together, NPFCPS-P+US is a promising antibiotics-alternative strategy for treating deeply seated bacterial infections.

Keywords: ESKAPE pathogens; bacterial pneumonia; cationic triphenylphosphanium bromide; pseudo‐conjugated polymer; sonodynamic therapy.


Conflict of interest statement

The authors declare no conflict of interest.

Figures

Scheme 1
Scheme 1
Schematic illustration of synthesis and bactericidal action of NPFCPS‐P. a) The polymer PFCPS was synthesized from the four monomers M1, M2, M3, and M4, among which the first three made up the polymer sonosensitizer FCPS while the last one harbored the ROS‐sensitive thioketal bond. Furthermore, PFCPS‐P was obtained by conjugating P+Ph3Br to M2 in FCPS. Here, FCPS‐P manifested as P+Ph3Br‐modified sonosensitizer FCPS. b) PFCPS‐P and DSPE‐mPEG2000 were self‐assembled together into the nanoparticle NPFCPS‐P. c) NPFCPS‐P was delivered in the lung of mouse via aerosolized intratracheal inoculation. NPFCPS‐P under US stimulation (NPFCPS‐P+US) produced high levels of ROS owing to FCPS‐mediated SDT activity. The generated ROS led to the breakage of ROS‐sensitive thioketal bonds in the polymers, resulting in the degradation of NPFCPS‐P and the release of FCPS‐P. This ROS‐responsive degradability endowed the highly favorable biosafety of NPFCPS‐P. The electrostatic interaction between cationic FCPS‐P and negatively charged bacteria surfaces would enhance the targeted attack on bacteria. SDT along with P+Ph3Br exhibited a synergistic effect for anti‐infection. NPFCPS‐P+US represented a highly biocompatible nanoplatform for antibiotics‐alternative treatment of acute bacterial pneumonia.
Figure 1
Figure 1
Characterization of NPFCPS‐P. a) TEM images of NPFCPS‐P. Scale bar = 100 nm. b) SEM images of NPFCPS‐P. Scale bar = 100 nm. c) STEM and EDXS images of NPFCPS‐P. Scale bar = 50 nm. d) UV–vis‐NIR absorption spectra of NPFCPS‐P and NPFCPS. e) Absorption curves of DPBF as a selective trapping agent to detect ROS in the reaction mixture of NPFCPS‐P under US stimulation (1.0 MHz, 1.5 W cm−2, 50% duty cycle). f) Trend of UV absorption at 410 nm for the above DPBF‐based detection results. g) ESR spectra demonstrating 1O2 generation of NPFCPS‐P or NPFCPS with US stimulation (1.5 W cm−2, 1.0 MHz, 50% duty cycle, 1 min). h) Absorption curves of DPA as a selective trapping agent to detect 1O2 in the reaction mixture of NPFCPS‐P under US stimulation (1.0 MHz, 1.5 W cm−2, 50% duty cycle). i) Trend of UV absorption at 378 nm for the above DPA‐based detection results. DLS detection of j) size distributions of NPFCPS‐P with or without US stimulation (1.0 MHz, 1.5 W cm−2, 50% duty cycle, 6 min).
Figure 2
Figure 2
Antibacterial efficacy against ESKAPE pathogens in vitro. US stimulation: 2.0 W cm−2, 1.0 MHz, 50% duty cycle, 15 min for Gram‐positive bacteria; 1.5 W cm−2, 1.0 MHz, 50% duty cycle, 6 min for Gram‐negative bacteria. a–f) Representative photographs of plate count agars for ESKAPE pathogens post‐treatment, and corresponding statistical analysis of bacterial counts. Data are presented as mean ± standard deviation (SD) (n = 3). ns (not significant): P ≥ 0.05, *: P < 0.05, **: P < 0.01, ***: P < 0.001, one‐way analysis of variance (ANOVA) with Tukey's multiple comparisons test. g) Representative images (n = 3) of live/dead bacteria post‐treatment as viewed by confocal laser scanning microscopy (CLSM). Red and green fluorescence signals correspond to dead and live bacterial cells, respectively. Scale bar = 20 µm.
Figure 3
Figure 3
Bacterial morphological and biochemical view of antibacterial mechanisms in vitro. US stimulation: 2.0 W cm−2, 1.0 MHz, 50% duty cycle, 15 min for Gram‐positive bacteria; 1.5 W cm−2, 1.0 MHz, 50% duty cycle, 6 min for Gram‐negative bacteria. a) SEM images of P. aeruginosa and S. aureus post‐treatment. Red arrows represent typical disruptions of bacterial morphology. Scale bar = 1 µm. b) DNA, c) Protein, d) K+ and e) GSH contents in supernatants of P. aeruginosa and S. aureus cultures post‐treatment. f) CLSM images of DAPI‐stained bacterial DNAs post‐treatment. Scale bar = 1 µm. g) Fluorescence images of P. aeruginosa and S. aureus post‐treatment indicating the generation of ROS. The scale bar is 100 µm. Data are presented as mean ± SD (n = 3). ns: P ≥ 0.05, *: P < 0.05, **: P < 0.01, ***: P < 0.001, one‐way ANOVA with Tukey's multiple comparisons test.
Figure 4
Figure 4
Metabolomics analysis of P. aeruginosa after treatment. a) PCA plot of clustered datasets between the two treatment groups NPFCPS‐P+US and Mock. US represents US stimulation (1.5 W cm−2, 1.0 MHz, 50% duty cycle, 8 min). b) Volcano plot of DRMs identified for NPFCPS‐P+US compared to Mock; Up: Up‐regulated metabolites. Down: Down‐regulated metabolites. c) KEGG pathway enrichment analysis of DRMs. d) Heat maps of selected DRMs, and e) diagrams of related dysregulated metabolic pathways. Red represents up‐regulation and blue stands for down‐regulation. Experiments were performed with 5 independent biological replicates.
Figure 5
Figure 5
Therapeutic efficacy against P. aeruginosa‐induced lung infections in mice. US stimulation: 1.0 MHz, 1.5 W cm−2, 50% duty cycle, 2 min. a) Schematic illustration of pulmonary delivery, infection establishment, and anti‐infective therapy. b) Timing diagram for various tests post‐therapy. c) Representative photographs of plate count agars for the lungs once infective therapy was applied, and d) corresponding statistical analysis of bacterial load counts. Data are presented as mean ± SD (n = 6). e) Pathological scores of lung tissues (n = 3) on days 0, 2, and 4 post‐therapy. ns: P ≥ 0.05, *: P < 0.05, **: P < 0.01, ***: P < 0.001, one‐way ANOVA with Tukey's multiple comparisons test. f) Representative photographs of H&E staining of the lungs. Scale bar = 100 µm. Blue arrows denote inflammatory cells such as neutrophils, macrophages, and lymphocytes. Red arrows stand for local bleeding. g) Survival curves and h) body weights of infected mice post‐therapy. Data are presented as mean ± SD (n = 10). ns: P ≥ 0.05, *: P < 0.05, **: P < 0.01, ***: P < 0.001, log‐rank Mantel–Cox test.
Figure 6
Figure 6
ELISA, IHS, and IFS assays of proinflammatory cytokines and lung injury repair proteins. US stimulation: 1.0 MHz, 1.5 W cm−2, 50% duty cycle, 2 min. a) Concentrations of proinflammatory cytokines TNF‐α, IL‐6, and IFN‐β in bronchoalveolar lavage fluids on days 0, 1, 2, and 4 post‐therapy. b) Representative IHS photographs and c) corresponding statistical analyses for expression levels of TNF‐α, IL‐6, and IFN‐β in the lungs on day 2 post‐therapy. Yellow‐brown represents positive detection. Scale bar = 100 µm. d) Representative IFS photographs and e) corresponding statistical analyses for expression levels of lung injury repair proteins SP‐C, α‐SMA, and VEGF‐A on day 2 post‐therapy. Red represents positive detection. Data are expressed as mean ± SD (n = 3). ns: P ≥ 0.05, *: P < 0.05, **: P < 0.01, ***: P < 0.001, one‐way ANOVA with Tukey's multiple comparisons test.
Figure 7
Figure 7
RNA‐seq assay of infected lung tissues on day 2 post‐therapy. a) PCA plot of clustered datasets between the two treatment groups NPFCPS‐P+US and Mock. US stimulation: 1.0 MHz, 1.5 W cm−2, 50% duty cycle, 2 min. b) Volcano plot of DGEs for NPFCPS‐P+US compared to Mock. Up: Up‐regulated genes. Down: Down‐regulated genes. Non‐SIG: non‐significantly differentially regulated genes. GO pathway enrichment analysis was performed for c) Down‐regulated and d) up‐regulated genes. e) Heat map of selected DRGs involved in inhibited inflammatory response and accelerated lung injury repair. Boxes indicate the 6 DRGs revealed simultaneously by IHS and RNA‐seq. Experiments were performed with 4 independent biological replicates.

Similar articles

References

    1. Garcia‐Vidal A., San Jose A., Torres, Int. J. Mol. Sci. 2016, 17, 2120. - PMC - PubMed
    1. De Oliveira D. M. P., Forde B. M., Kidd T. J., Harris P. N. A., Schembri M. A., Beatson S. A., Paterson D. L., Walker M. J., Clin. Microbiol. Rev. 2020, 33, 10. - PMC - PubMed
    1. Choi M. H., Kim D., Lee K. H., Cho J. H., Jeong S. H., Int. J. Antimicrob. Agents 2023, 62, 106886. - PubMed
    1. Torres A., Cilloniz C., Niederman M. S., Menendez R., Chalmers J. D., Wunderink R. G., van der Poll T., Nat. Rev. Dis. Primers 2021, 7, 25. - PubMed
    1. a) Ma Y. X., Wang C. Y., Li Y. Y., Li J., Wan Q. Q., Chen J. H., Tay F. R., Niu L. N., Adv. Sci. (Weinh). 2020, 7, 1901872; - PMC - PubMed
    2. b) Aloke C., Achilonu I., Microb. Pathog. 2023, 175, 105963. - PubMed

LinkOut - more resources