. 2025 Apr;97(4):e70319.
doi: 10.1002/jmv.70319.

Papaverine Targets STAT Signaling: A Dual-Action Therapy Option Against SARS-CoV-2

Affiliations

Papaverine Targets STAT Signaling: A Dual-Action Therapy Option Against SARS-CoV-2

Philipp Reus et al. J Med Virol. 2025 Apr.

Abstract

Papaverine (PV) has been previously identified as a promising candidate in SARS-CoV-2 repurposing screens. In this study, we further investigated both its antiviral and immunomodulatory properties. PV displayed antiviral efficacy against SARS-CoV-2 and influenza A viruses H1N1 and H5N1 in single infection as well as in co-infection. We demonstrated PV's activity against various SARS-CoV-2 variants and identified its action at the post-entry stage of the viral life cycle. Notably, treatment of air-liquid interface (ALI) cultures of primary bronchial epithelial cells with PV significantly inhibited SARS-CoV-2 levels. Additionally, PV was found to attenuate interferon (IFN) signaling independently of viral infection. Mechanistically, PV decreased the activation of the IFN-stimulated response element following stimulation with all three IFN types by suppressing STAT1 and STAT2 phosphorylation and nuclear translocation. Furthermore, the combination of PV with approved COVID-19 therapeutics molnupiravir and remdesivir demonstrated synergistic effects. Given its immunomodulatory effects and clinical availability, PV shows promising potential as a component for combination therapy against COVID-19.

Keywords: SARS‐CoV‐2; antiviral; immunomodulatory; interferon; papaverine.


Conflict of interest statement

The authors declare no conflicts of interest.

Figures
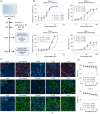
Figure 1
Figure 1
PV and its derivatives exhibit antiviral activity against both SARS‐CoV‐2 and IAV H1N1. (a) Experimental scheme of the antiviral and toxicity experiments. Caco‐2 or Calu‐3 cells were pretreated with PV, EV, or DV 1 h before infection with SARS‐CoV‐2 (MOI 0.01) or IAV (H1N1, MOI 0.01 or H5N1, MOI 0.001) for measurement of antiviral activity or mock‐infection for determination of compound toxicity via SRB assay. (b) Dose‐response curves and IC50 values of Caco‐2 and Calu‐3 cells treated with PV, EV, or DV and infected with SARS‐CoV‐2 (D614G variant) or IAV, measured via immunocytochemistry. (c) Representative immunofluorescence images of Calu‐3 cells infected with SARS‐CoV‐2 (Delta variant) or IAV H1N1/H5N1. (d) Cytotoxicity measurement of uninfected Caco‐2 or Calu‐3 cells treated with PV, EV, or DV, measured via SRB assay. Results are expressed as the mean ± SD.
Figure 2
Figure 2
PV is effective against SARS‐CoV‐2 and IAV H1N1 co‐infection. (a) Representative immunofluorescence images of Calu‐3 cells, pretreated with PV 1 h before infection with SARS‐CoV‐2 (Delta, MOI 0.1) and/or IAV (A/Puerto Rico/8/34(H1N1), MOI 0.1) for 24 h for measurement of antiviral activity. (b) SARS‐CoV‐2 and IAV infection levels of untreated Calu‐3 cells after 24 h of infection. (c) Comparison of IC50 values of PV against SARS‐CoV‐2 and IAV in a single versus co‐infection scenario.
Figure 3
Figure 3
PV inhibits SARS‐CoV‐2 in airway epithelium cells post‐entry. (a) Experimental scheme of the antiviral testing against different virus variants. Calu‐3 cells were pretreated with PV, EV, or DV 1 h before infection with different SARS‐CoV‐2 variants (MOI 0.01). (b) The IC50 values were derived from the dose‐response curves (c) of Calu‐3 cells treated with PV, EV, or DV and infected with different variants of concern, as determined by immunocytochemistry. (d) Experimental scheme of the “time of addition” experiments. Calu‐3 cells were infected with SARS‐CoV‐2 (Delta variant, MOI 2) for 8 h. For condition #1, treatment with PV, EV, or DV occurred only during the first hour of infection (virus entry phase); for condition #2, treatment occurred after entry until end of the experiment 8 h post‐infection. (e) and (f) Levels of SARS‐CoV‐2 E gene RNA after treatment with PV, EV, or DV during (e) or after (f) virus entry, respectively, as determined by qRT‐PCR. (g) Experimental scheme of the antiviral testing of HBEpCs, infected with different SARS‐CoV‐2 (Omicron BA.1 variant, MOI 1) and subsequently treated with PV dilutions. Seventy‐two hours after infection, the cells were processed for further analysis. (h) Effect of PV treatment on SARS‐CoV‐2 RNA levels from cell supernatants using qRT‐PCR. (i) Cytotoxicity of PV in HBEpCs from the apical medium measured via LDH release assay. p‐values were calculated via Brown–Forsythe test (e), Kruskal–Wallis test (f) or ordinary one‐way ANOVA ((h) and (i)) and are indicated for each significant group compared to the untreated virus control. Results are expressed as the mean ± SD.
Figure 4
Figure 4
PV inhibits IFN signaling independently of virus infection. (a) and (b) Representative immunoblot images of Calu‐3 cells treated with different concentrations of PV and either infected with SARS‐CoV‐2 (Delta variant) (a) or stimulated with 1 µg/mL poly I:C (b). (c) Densitometric quantification and statistic evaluation of the bands in (b). (d) Experimental scheme of interferon release measurements. Calu‐3 cells were treated with PV and stimulated with poly I:C for 24 h, and the cell supernatant subsequently incubated with HEK‐Blue reporter cells for IFN type I, II, or III, respectively. After 24 h, interferon release was determined via IFN reporter activity measurement (e). (f) Experimental scheme of interferon stimulated response element (ISRE) activation assay. HEK‐Blue ISG reporter cells were treated with PV or baricitinib (BAR) and stimulated with IFN type I, II, or III, respectively. Inhibition of ISRE activation was determined after 24 h (g). (h) Scheme of potential targets of PV's effect on innate immune activation. p‐values were calculated via ordinary one‐way ANOVA and are indicated for each significant group compared to the untreated virus‐ or poly I:C‐control, respectively. Results are expressed as the mean ± SD.
Figure 5
Figure 5
Papaverine inhibits phosphorylation and nuclear translocation of pSTAT1 and pSTAT2 in Calu‐3 and HEK‐Blue ISG cells. (a) Representative immunoblot images of Calu‐3 cells treated with PV and stimulated with IFN β for 1, 12, or 24 h. (b) Densitometric quantification and statistic evaluation of the pSTAT1 and pSTAT2 bands in (a). (c) Representative immunofluorescence pictures of HEK‐Blue ISG reporter cells treated with PV or BAR and stimulated with IFN β for 1 h. The inhibition of pSTAT1/2 activation and translocation was determined through the percentage of cells with nuclear pSTAT1/2 (d) and fluorescence intensity of pSTAT1/2 in cells with nuclear signal (e), each compared to the respective IFN β control. (f) and (g) Cells with nuclear pSTAT1/2 and fluorescence intensity of pSTAT1/2 in cells with nuclear signal over time. p‐values were calculated via unpaired t‐test ((b) and (e)), Brown–Forsythe test (d) or two‐way ANOVA ((f) and (g)) and are indicated for each significant group compared to the respective untreated IFN β control. Results are expressed as the mean ± SD.
Figure 6
Figure 6
Papaverine indicates potential for combination therapy with other anti‐SARS‐CoV‐2 drugs. (a) Experimental setup of the combination experiments. Calu‐3 cells were treated with PV and remdesivir (REM), EIDD‐1931 (EIDD) or nirmatrelvir (NIR), respectively, in different concentration combinations and subsequently infected with SARS‐CoV‐2 (Delta variant). (b)–(d) Synergy distribution matrices and mean ZIP synergy score across all concentrations of combination treatments with PV and REM, EIDD, or NIR, respectively. A ZIP score of > 10 indicates synergistic action of the tested compounds. The green rectangle denotes the highest synergistic area with its respective synergy score. The corresponding percentages of inhibition and the synergy scores for each combination can be found in Figures S4 and S5. (e) and (g) Representative pictures of the effect of the drug combinations in the highest synergistic area's center concentrations. Results are expressed as the mean of three independent experiments.

Similar articles

References

    1. Mathieu E., Ritchie H., Rodés‐Guirao L., et al., Coronavirus Pandemic (COVID‐19) (2020), accessed October 6, 2023, https://ourworldindata.org/coronavirus.
    1. Montazersaheb S., Hosseiniyan Khatibi S. M., Hejazi M. S., et al., “COVID‐19 Infection: An Overview on Cytokine Storm and Related Interventions,” Virology Journal 19, no. 1 (2022): 92, 10.1186/s12985-022-01814-1. - DOI - PMC - PubMed
    1. Iketani S., Mohri H., Culbertson B., et al., “Multiple Pathways for SARS‐CoV‐2 Resistance to Nirmatrelvir,” Nature 613, no. 7944 (2023): 558–564, 10.1038/s41586-022-05514-2. - DOI - PMC - PubMed
    1. Wang L., Berger N. A., Davis P. B., Kaelber D. C., Volkow N. D., and Xu R., COVID‐19 Rebound After Paxlovid and Molnupiravir During January‐June 2022 (Infectious Diseases (except HIV/AIDS), 2022), 10.1101/2022.06.21.22276724. - DOI
    1. Takeuchi K., “Reactivity of the Human Internal Thoracic Artery to Vasodilators in Coronary Artery Bypass Grafting,” European Journal of Cardio‐Thoracic Surgery 26, no. 5 (2004): 956–959, 10.1016/j.ejcts.2004.07.047. - DOI - PubMed

MeSH terms