

The Impact of Atlas Parcellation on Functional Connectivity Analysis Across Six Psychiatric Disorders
- PMID: 40172075
- PMCID: PMC11963075
- DOI: 10.1002/hbm.70206
The Impact of Atlas Parcellation on Functional Connectivity Analysis Across Six Psychiatric Disorders
Abstract
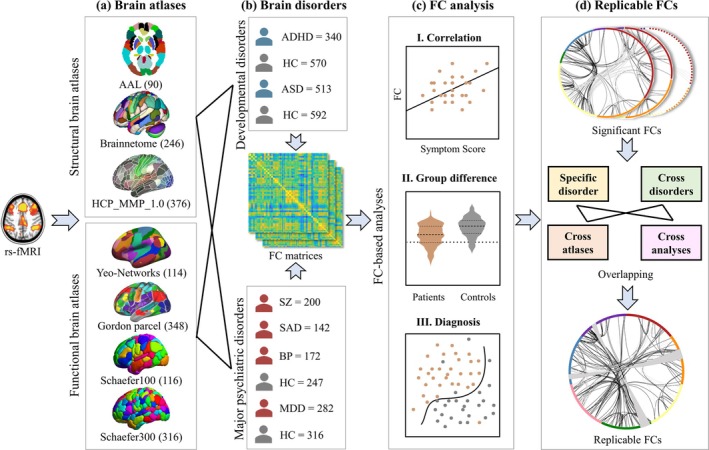
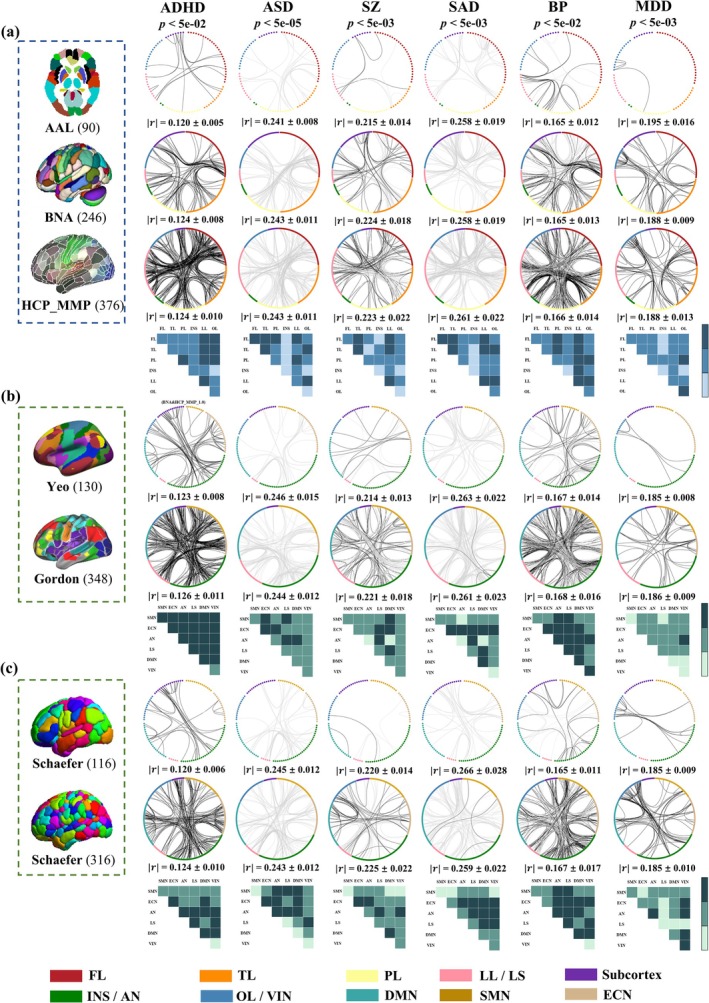
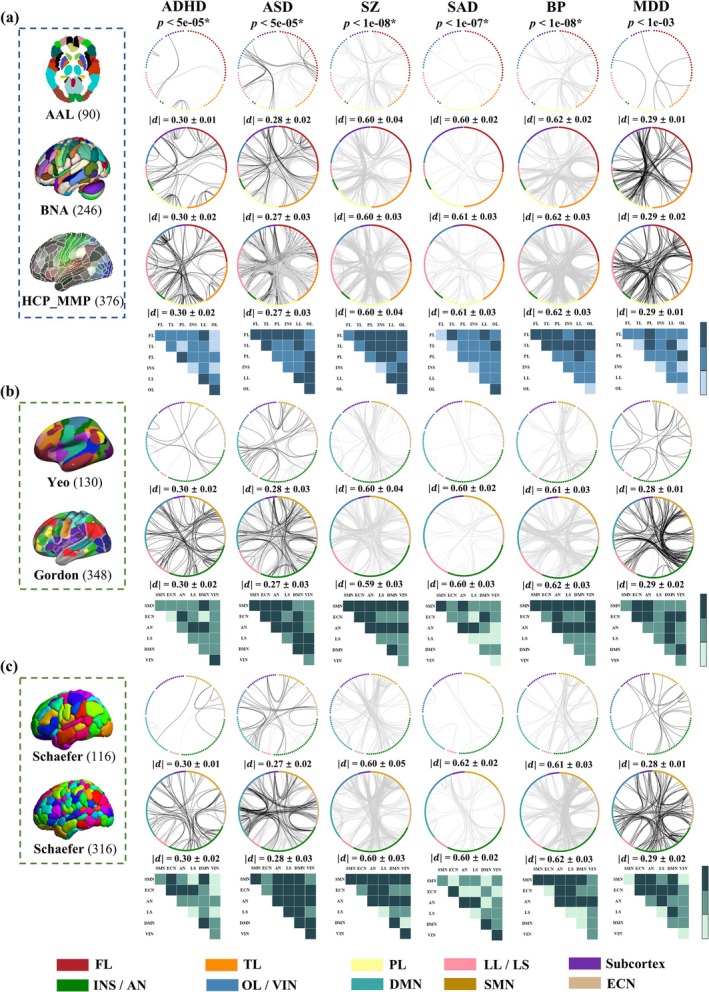
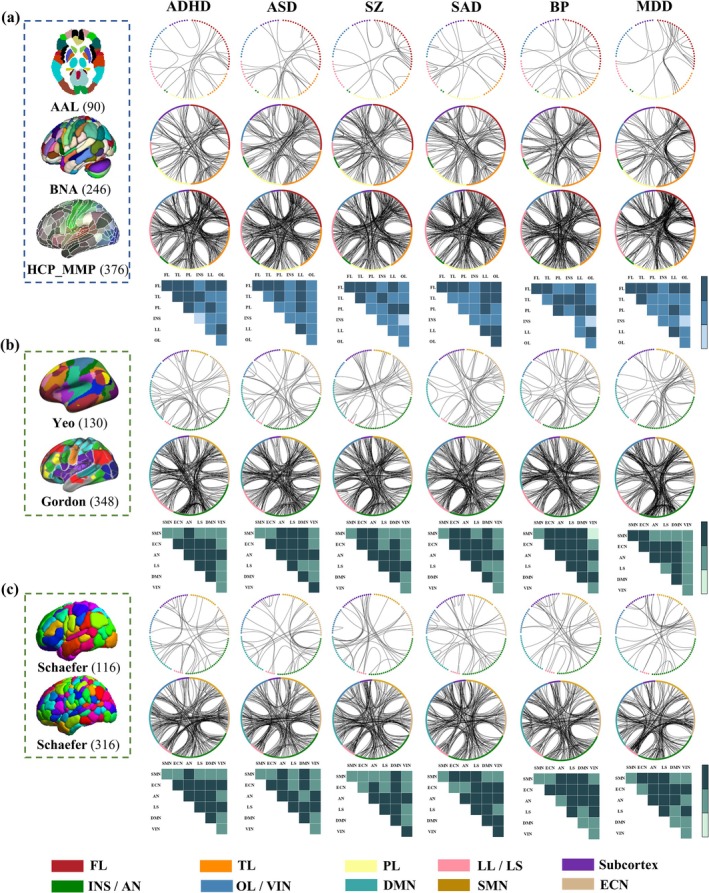
Neuropsychiatric disorders are associated with altered functional connectivity (FC); however, the reported regional patterns of functional alterations suffered from low replicability and high variability. This is partly because of differences in the atlas and delineation techniques used to measure FC-related deficits within/across disorders. We systematically investigated the impact of the brain parcellation approach on the FC-based brain network analysis. We focused on identifying the replicable FCs using three structural brain atlases, including Automated Anatomical Labeling (AAL), Brainnetome atlas (BNA) and HCP_MMP_1.0, and four functional brain parcellation approaches: Yeo-Networks (Yeo), Gordon parcel (Gordon) and two Schaefer parcelletions, among correlation, group difference, and classification tasks in six neuropsychiatric disorders: attention deficit and hyperactivity disorder (ADHD, n = 340), autism spectrum disorder (ASD, n = 513), schizophrenia (SZ, n = 200), schizoaffective disorder (SAD, n = 142), bipolar disorder (BP, n = 172), and major depression disorder (MDD, n = 282). Our cross-atlas/disorder analyses demonstrated that frontal-related FC deficits were reproducible in all disorders, independent of the atlasing approach; however, replicable FC extraction in other areas and the classification accuracy were affected by the parcellation schema. Overall, functional atlases with finer granularity performed better in classification tasks. Specifically, the Schaefer atlases generated the most repeatable FC deficit patterns across six illnesses. These results indicate that frontal-related FCs may serve as potential common and robust neuro-abnormalities across 6 psychiatric disorders. Furthermore, in order to improve the replicability of rsfMRI-based FC analyses, this study suggests the use of functional templates at larger granularity.
Keywords: brain atlases; brain network analysis; functional connectivity; psychiatry; replicability.
© 2025 The Author(s). Human Brain Mapping published by Wiley Periodicals LLC.
Conflict of interest statement
The authors declare no conflicts of interest.
Figures
Similar articles
-
Investigating resting-state functional connectivity changes within procedural memory network across neuropsychiatric disorders using fMRI.BMC Med Imaging. 2025 Jan 13;25(1):18. doi: 10.1186/s12880-024-01527-7. BMC Med Imaging. 2025. PMID: 39806317 Free PMC article.
-
Consistent frontal-limbic-occipital connections in distinguishing treatment-resistant and non-treatment-resistant schizophrenia.Neuroimage Clin. 2025;45:103726. doi: 10.1016/j.nicl.2024.103726. Epub 2024 Dec 12. Neuroimage Clin. 2025. PMID: 39700898 Free PMC article.
-
A human brain atlas derived via n-cut parcellation of resting-state and task-based fMRI data.Magn Reson Imaging. 2016 Feb;34(2):209-18. doi: 10.1016/j.mri.2015.10.036. Epub 2015 Oct 31. Magn Reson Imaging. 2016. PMID: 26523655 Free PMC article.
-
Mapping stroke outcomes: A review of brain connectivity atlases.J Neuroimaging. 2024 Sep-Oct;34(5):548-561. doi: 10.1111/jon.13228. Epub 2024 Aug 12. J Neuroimaging. 2024. PMID: 39133035 Review.
-
Psychoradiological patterns of small-world properties and a systematic review of connectome studies of patients with 6 major psychiatric disorders.J Psychiatry Neurosci. 2018 Nov 1;43(6):427. doi: 10.1503/jpn.170214. J Psychiatry Neurosci. 2018. PMID: 30375837 Free PMC article.
References
-
- ADOS . 2013. Encyclopedia of Autism Spectrum Disorders, edited by Volkmar F. R., 60. Springer.
-
- Birur, B. , Kraguljac N. V., Shelton R. C., and Lahti A. C.. 2017. “Brain Structure, Function, and Neurochemistry in Schizophrenia and Bipolar Disorder—A Systematic Review of the Magnetic Resonance Neuroimaging Literature.” NPJ Schizophrenia 3, no. 1: 15. 10.1038/s41537-017-0013-9. - DOI - PMC - PubMed
MeSH terms
Grants and funding
LinkOut - more resources
Full Text Sources
Medical
Miscellaneous
