. 2025 Jul;40(7):1369-1378.
doi: 10.1002/mds.30182. Epub 2025 Apr 2.

Trajectories of Pontine Volume in Patients with Multiple System Atrophy

Affiliations

Trajectories of Pontine Volume in Patients with Multiple System Atrophy

Kazuya Kawabata et al. Mov Disord. 2025 Jul.

Abstract

Objectives: To investigate trajectories of regional brain volume changes in multiple system atrophy (MSA) and their potential utility as surrogate markers of disease progression in the cerebellar subtype (MSA-C).

Background: Reliable biomarkers for tracking disease progression in MSA are urgently needed. Although several studies have explored neuroimaging markers, imaging measures that are reliable and reproducible at the individual-level are lacking.

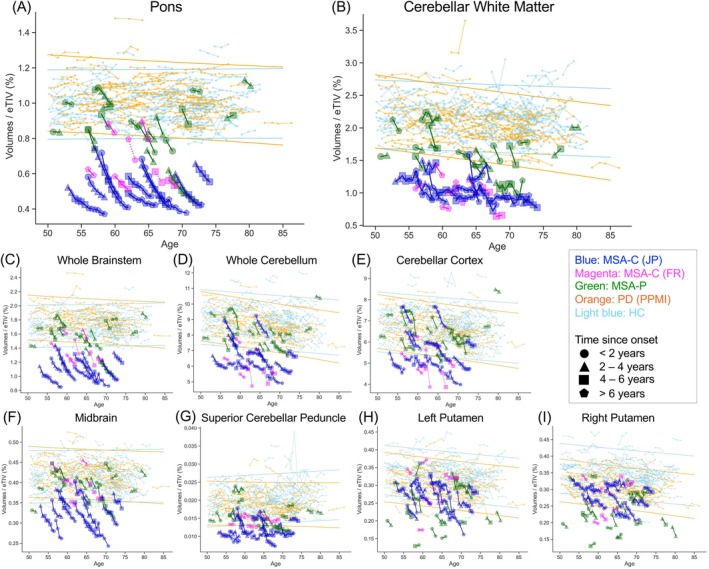
Methods: Longitudinal three-dimensional (3D)-T1 images from multiple cohorts of 21 subjects with probable MSA-C, 19 with probable MSA-parkinsonian subtype (MSA-P), 113 with Parkinson's disease, and 227 healthy controls were processed using the FreeSurfer longitudinal pipeline. Extracted volumes were assessed for individual longitudinal trajectories, intra-individual variability, and pontine regional volume decline.

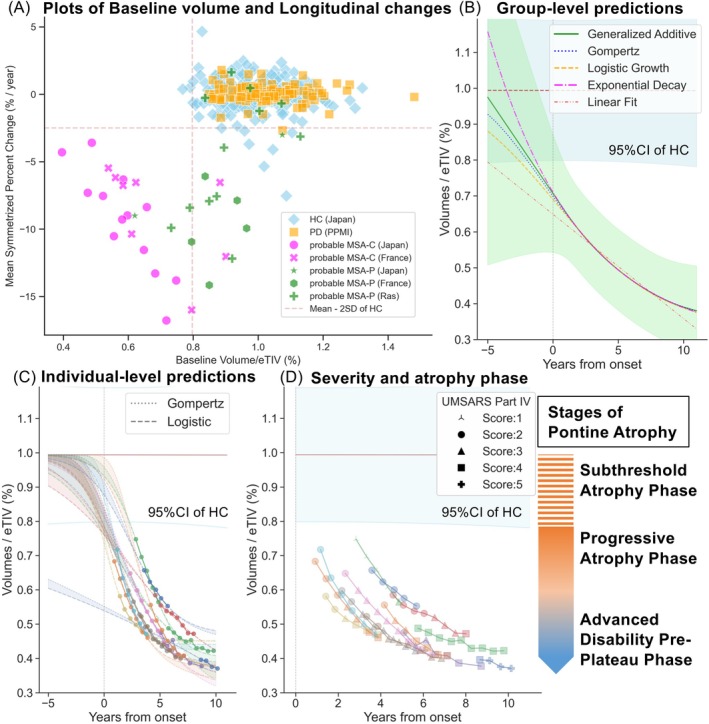
Results: Pontine volumes showed lower intra-individual variability in measurements compared with other infratentorial brain regions. All probable MSA-C patients exhibited a decline in pontine volume, ranging from -3.6% to -16.8% per year (mean: -9.1%), falling more than two standard deviations below the mean of healthy controls. In MSA-C, the temporal dynamics of pontine volumes exhibited nonlinear changes, characterized by progressive atrophy in the earlier period of the disease, followed by a pre-plateau phase associated with advanced disability in the later period. Predictive modeling suggests that pontine atrophy may begin before symptom onset of MSA-C.

Conclusions: Pontine volume is a sensitive marker of disease progression, exhibiting a nonlinear decline with low intra-individual variability in measurements and greater volume loss in the earlier stages, reaching a pre-plateau phase in the later stages with advanced disability. © 2025 The Author(s). Movement Disorders published by Wiley Periodicals LLC on behalf of International Parkinson and Movement Disorder Society.


Figures

FIG. 1
FIG. 1
Trajectories of the ratios of regional volumes divided by the estimated total intracranial volume. Each point represents the regional volume as a percentage of the total intracranial volume, with a line connecting data points from each participant. The dot shape represents time since onset, and the color indicates group membership, as shown in the legend. The light blue and orange lines represent upper and lower limits of the 95% confidence interval of linear models predicting volumes, with baseline age as the only dependent variable for healthy controls (HC) and patients with Parkinson's disease (PD), respectively. (A) Pons, (B) cerebellar white matter, (C) whole brainstem, (D) whole cerebellum, (E) cerebellar cortex, (F) midbrain, (G) superior cerebellar peduncle, (H) left putamen, (I) right putamen. MSA‐C (JP), probable MSA‐C from Japanese cohort; MSA‐C (FR), probable MSA‐C from French cohort; PD (PPMI), PD from Parkinson's Progression Markers Initiative cohort, and HC from Japanese cohort. MSA‐P in this figure includes probable MSA‐P from three cohorts: Japanese, French, and MSA‐RAS. Dashed lines indicate subjects with incomplete cerebellum in the original images in the French data, affecting cerebellar volumes but no other regions. [Color figure can be viewed at wileyonlinelibrary.com]
FIG. 2
FIG. 2
Longitudinal changes in pontine volume and predictions. (A) Plots of baseline volume and longitudinal rate of volume change. The x‐axis represents the baseline pontine volume as percent of the estimated total intracranial volume (eTIV), whereas the y‐axis represents the mean symmetrized percent change per year (%/year). Marker shapes and colors correspond to the cohort and group membership as indicated in the legend. The horizontal and vertical dashed lines indicate the mean minus two standard deviations (SD) of HC. The focus on the pons was due to its significant role in MSA‐C pathophysiology and its lower intra‐individual variability, as detailed in our analysis. (B) Population‐level predictions. Lines represent population trajectories of the regional percent volume of pons for MSA‐C patients who were assessed at more than three visits. For reference, the predicted value for HC is shown as a horizontal red dashed line with the light blue shading represent the 95% confidence interval (CI), calculated using linear regression with time as the dependent variable. The light green band around the predicted lines represents the 95% CI of the generalized additive model. (C) Individual‐level predictions. Dotted lines represent individual predictions using the Gompertz model, while dashed lines represent individual predictions using the logistic‐growth model. The Gompertz model showed steeper declines in the early period compared with the logistic‐growth model. The difference between the two models is shaded, with colors representing different patients. The light blue line represents the lower limit of the 95% CI for HC. (D) Severity and atrophy phase. This figure depicts longitudinal trajectories of pontine volumes, expressed as a percentage of total intracranial volume, with each marker coded according to Unified Multiple System Atrophy Rating Scale (UMSARS) Part IV scores, a global disability scale. Rating range is from one to five, with higher scores representing severe disability. Stages of pontine atrophy, shown on the right, indicate three different phases: subthreshold atrophy phase, progressive atrophy phase, and advanced disability pre‐plateau phase. The relationship between volumes and disability scores is also shown in Supplementary Table S4. [Color figure can be viewed at wileyonlinelibrary.com]

Similar articles

Cited by

References

    1. Poewe W, Stankovic I, Halliday G, et al. Multiple system atrophy. Nat Rev Dis Primers 2022;8(1):56. 10.1038/s41572-022-00382-6 - DOI - PubMed
    1. Wenning GK, Stankovic I, Vignatelli L, et al. The Movement Disorder Society criteria for the diagnosis of multiple system atrophy. Mov Disord 2022;37(6):1131–1148. 10.1002/mds.29005 - DOI - PMC - PubMed
    1. Heim B, Krismer F, Poewe W, Seppi K. Imaging markers of disease progression in multiple system atrophy. Future Neurol 2019;14(3):FNL24. 10.2217/fnl-2018-0045 - DOI
    1. Krismer F, Péran P, Beliveau V, et al. Progressive brain atrophy in multiple system atrophy: a longitudinal, multicenter, magnetic resonance imaging study. Mov Disord 2024;39(1):119–129. 10.1002/mds.29633 - DOI - PubMed
    1. Wenning GK, Geser F, Krismer F, et al. The natural history of multiple system atrophy: a prospective European cohort study. Lancet Neurol 2013;12(3):264–274. 10.1016/S1474-4422(12)70327-7 - DOI - PMC - PubMed

LinkOut - more resources