Comparative Study
. 2025 Jun 4;230(2):iyaf061.
doi: 10.1093/genetics/iyaf061.

Heat tolerance and genetic adaptations in Caenorhabditis briggsae: insights from comparative studies with Caenorhabditis elegans

Affiliations
Comparative Study

Heat tolerance and genetic adaptations in Caenorhabditis briggsae: insights from comparative studies with Caenorhabditis elegans

Nikita Jhaveri et al. Genetics. .

Abstract

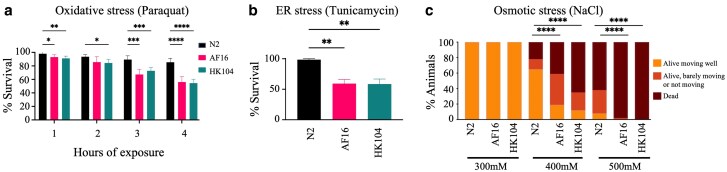
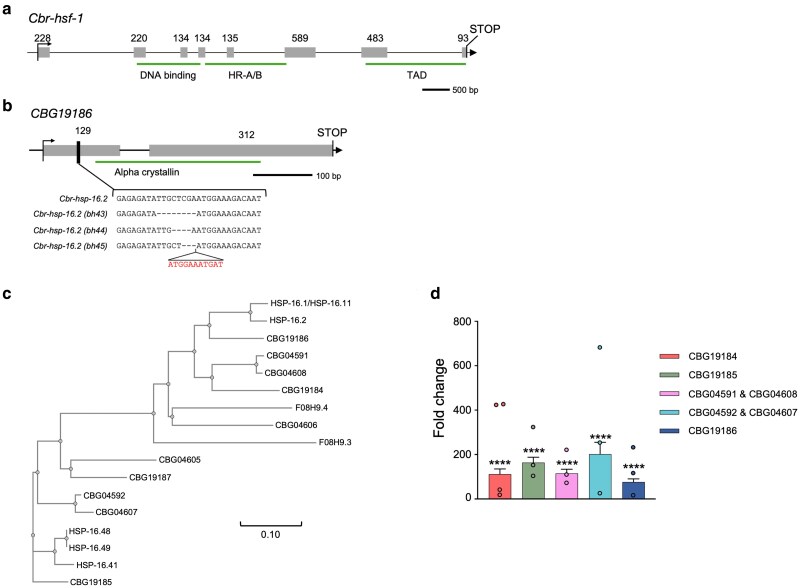
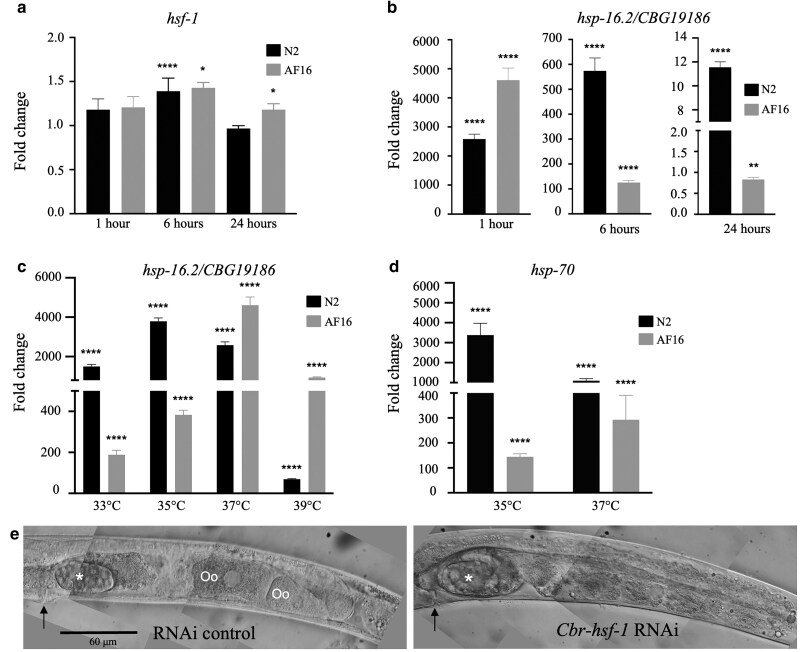
Temperature tolerance varies widely across species and plays a crucial role in shaping physiological and evolutionary adaptations. Here, we investigate thermal stress responses in Caenorhabditis briggsae and Caenorhabditis elegans using multiple isolates. Our results demonstrate that C. briggsae exhibits enhanced survival, growth, and reproduction at elevated temperatures compared to C. elegans. The increased heat resistance was evident from the L1 larval stage. Notably, C. briggsae isolates from both tropical and temperate regions were equally resistant to heat stress, suggesting that elevated thermal tolerance is an intrinsic feature of this species. To explore the molecular genetic basis of thermal tolerance, we examined expression of heat shock regulators. Transcriptional analysis revealed that C. briggsae mounts a rapid and robust heat shock response, with CBG19186, the closest ortholog of C. eleganshsp-16.2, showing higher induction and faster recovery dynamics. The peak expression of hsp-16.2/CBG19186 occurred at a temperature 2°C higher in C. briggsae than in C. elegans. These findings provide the first in vivo evidence of temperature differences in the transcriptional response of a single protein between the 2 species, suggesting that C. briggsae has evolved a higher thermal limit for key molecular processes, likely contributing to its ability to withstand extreme temperatures. Despite its superior thermal resistance, C. briggsae showed higher sensitivity to oxidative, osmotic, and endoplasmic reticulum stress, suggesting a potential fitness trade-off. Our findings demonstrate significant differences in stress sensitivities between the 2 nematodes, providing a foundation for further investigations into the molecular and evolutionary mechanisms underlying their stress responses.

Keywords: HSF-1; HSP-16.2; WormBase; heat shock protein; heat stress; nematode; thermal tolerance.


Conflict of interest statement

Conflicts of interest: The author(s) declare no conflicts of interest.

Figures

Fig. 1.
Fig. 1.
Analysis of male frequency, embryogenesis time, and counts of embryos in hermaphrodite uterus. a, top) Frequency of spontaneous males in cultures grown at 20°C. Mean and standard deviation (SD) are plotted. Fisher's exact test was used to analyze data. No C. briggsae isolates showed significant difference from C. elegansN2. a, bottom) Male frequency in N2 and AF16 grown at 15°C, 20°C, and 25°C. Mean and SD are plotted; for clarity, SD is shown only on one side. Data were analyzed using Fisher's exact test. Only 15°C comparison was found to be significant. b) Developmental timing of embryogenesis in C. elegans (CEL) and C. briggsae (CBR) at 20°C. Double-headed arrows represent the approximate range and proportion of each embryonic stage at the given time point. At 30-min postlaying, approximately one-quarter of C. briggsae embryos were at the 2- to 4-cell stage, whereas all C. elegans embryos had initiated gastrulation. The number of animals analyzed at each time point was as follows: 30 min (61 N2, 78 AF16), 150 min (41 N2, 52 AF16), 180 min (38 N2, 51 AF16), 270–300 min (65 N2, 62 AF16), 360–390 min (70 N2, 85 AF16), 460–490 min (29 N2, 28 AF16), 540–570 min (25 N2, 33 AF16), 600–630 min (173 N2, 182 AF16), 660–690 min (125 N2, 80 AF16), 720–780 min (159 N2, 179 AF16), and 820 min (70 N2, 53 AF16). c) Adult hermaphrodites carrying embryos in their uterus. C. elegans holds more embryos compared to C. briggsae. Two early-stage embryos (2-cell and 4-cell stages) laid by C. briggsae animals are indicated. The graph on the right shows the number of embryos in each strain (mean ± SD). Total n = 29 for AF16 and n = 27 for N2. Data were compared using Mann–Whitney test. Three or more independent biological replicates were examined for each panel of data. Asterisks mark comparisons that are statistically significant. *P < 0.05 and ****P < 0.0001.
Fig. 2.
Fig. 2.
Developmental time and reproductive span at various temperatures. a–d) Developmental analysis of N2, AF16, and HK104 strains at 15˚C, 20˚C and 25˚C. a, b) Embryogenesis time. Four to 10 independent biological replicates were examined. The total numbers of animals were 346 (N2), 322 (AF16), and 219 (HK104)—15°C embryogenesis; 419 (N2), 317 (AF16), and 219 (HK104)—20°C embryogenesis; 207 (N2), 167 (AF16), and 169 (HK104)—25°C embryogenesis; 230 (N2), 261 (AF16), and 144 (HK104)—15°C adulthood; 263 (N2), 265 (AF16), and 242 (HK104)—20°C adulthood; and 256 (N2), 220 (AF16), and 196 (HK104)—25°C adulthood. a) The proportion of embryos that hatched at each time point. The graphs show the best curve fit for each strain. b) Histograms show average median times of replicates (± SD). c, d) Similar plots as in a) and b), except that data show time taken by embryos to reach adulthood. Four to 7 independent biological replicates were examined, with total animals ranging from 144 to 265. b, d) Kruskal–Wallis with Dunn's multiple comparisons tests was used to compare the difference between N2 and AF16 and between N2 and HK104. e–g) Reproductive spans of N2, AF16, and HK104 at 15°C e), 20°C f), and 25°C g). Three independent replicates were tested (total n = 10–25 worms) at each temperature and each strain. Data were analyzed using Mantel–Cox log-rank test. Asterisks mark comparisons that are statistically significant. *P < 0.05; **P < 0.01; and ****P < 0.0001.
Fig. 3.
Fig. 3.
Effect of heat stress on AF16 and N2. a) N2 and AF16 day 1 adults were exposed to a range of temperatures each for 2 h, and their responses in 3 broad categories were plotted as stacked histograms. b) Similar treatments involving AF16 and 3 other C. briggsae isolates. a, b) Data were analyzed using χ2 test. c–h) Day 1 N2 and AF16 adults after heat shock at 37°C for 2- and 24-h recovery at 20°C. c, d) Animals on culture plates. N2 worms are either dead (arrowhead), alive but not moving actively (thick arrow), or moving actively (arrow). All AF16 animals are actively moving (arrows). e, f) Representative images of N2 and AF16 animals following heat stress. The AF16 worm appears to have recovered well. g, h) Zoomed-in view of the head region of the animals as in e) and f). Pharynx outline is shown by dotted lines. The stars (*) mark the anterior pharyngeal bulb, which appears structurally less defined in N2 compared to AF16, where it maintains a more uniform and symmetrical morphology and muscles fibers appear intact. The bracketed region in N2 shows the posterior pharyngeal bulb with misshapen grinder (arrowhead), including vacuole-like structures in the surrounding region (arrows). In contrast, the corresponding region in AF16 animal including the grinder (arrowhead) appears structurally intact. i) Survival of 35°C exposed day 1 adults. Mean and standard deviation (SD) are plotted. j) Histograms showing the proportion of early and late-stage embryos (separated by dashed vertical line) that hatched into L1 larvae (see Materials and methods for details) following 35°C exposures. AF16* and N2* refer to embryos that were allowed to recover for 90 min at 20°C before treatments. Mean and SD are plotted. k) Same plot as i), except that L1 larvae were examined. i, k) χ2 test was used to calculate the difference between N2 and AF16 at each time point. j) Two-way ANOVA with Sidak's multiple comparisons test was used to analyze data. In all cases, animals were examined in 3 independent biological batches for each strain and temperature condition. Total N values are 90–120 a, b), 61–105 i), 78–198 j), and 90–164 k). Asterisks mark comparisons that are statistically significant. *P < 0.05; **P < 0.01; ***P < 0.001; and ****P < 0.0001.
Fig. 4.
Fig. 4.
Responses of C. briggsae and C. elegans to different stress treatments. a) Day 1 adults were treated with 200 mM paraquat (oxidative stress inducer) for 4 h. Survival was determined after each hour and plotted as mean ± SD. Data were analyzed using 2-way ANOVA with Sidak's multiple comparisons test. b) Day 1 adults were treated with 50-ng/μL tunicamycin for 24 h (ER stress inducer), and survival was quantified (mean ± SD). Data were analyzed using Kruskal–Wallis test with Dunn's multiple comparisons test. c) Day 1 AF16, HK104, and N2 adults were exposed to NaCl for 24 h, and survival was scored and plotted as stacked histogram. Data were analyzed using χ2 test. Data in a) and b) are represented as mean ± SD. For each assay, a total of 3 independent biological replicates were examined. Each batch in a) and b) consists of samples collected from 2 wells for each strain. Total N values are 142–171 a), 180–220 b), and 100–168 c) for each strain. Asterisks mark comparisons that are statistically significant. *P < 0.05; **P < 0.01; ***P < 0.001; and ****P < 0.0001.
Fig. 5.
Fig. 5.
hsf-1 and hsp-16.2 gene structures, CRISPR-induced alleles, and phylogenetic relationships. a, b) Gene structures of Cbr-hsf-1 and CBG19186 based on cDNA analysis. The ORFs are 2,016 (Cbr-hsf-1) and 441 bp (CBG19186) long. Major functional domains are indicated. CRISPR-induced CBG19186 alleles affect a region in the first exon. The wild-type sequence is shown in the first row, and deletions are in subsequent rows. The bh45 allele also carries a small insertion. c) Phylogenetic tree of the hsp16 genes in C. elegans and C. briggsae. HSP-16.1 and HSP-16.11 have identical sequences. Branch lengths are indicated by a horizontal scale bar. d) Fold changes in hsp gene expression in C. briggsae following heat treatment at 35°C for 1 h. Expression levels are presented relative to untreated controls (mean ± standard error of mean). BioRad CFX Maestro 3.1 software (https://www.bio-rad.com/en-ca/product/cfx-maestro-software-for-cfx-real-time-pcrinstruments) was used to analyze data and perform Student's t-test. Bars showing statistically significant values compared to controls are marked by asterisks. ****P < 0.0001.
Fig. 6.
Fig. 6.
qPCR analyses of hsf-1, hsp-16.2, and hsp-70 expression following heat treatments. a, b) Relative expression levels of hsf-1 a) and hsp-16.2/CBG19186 b) in N2 and AF16 animals, as determined by qPCR. Animals were heat-shocked at 35°C for 1 h, and expression was analyzed after recovery periods of 1, 6, and 24 h. c, d) Bar graphs showing expression levels of hsp-16.2 in N2 and CBG19186 in AF16 c) and hsp-70 d), in animals exposed to various temperatures for 1 h. Data are represented as mean ± standard error of mean (SEM). e) Representative images of L4440 control and Cbr-hsf-1 RNAi-treated animals, showing embryos (*) and oocytes (Oo). Vulval openings are marked by arrows. No oocytes are visible in the hsf-1(RNAi) animal. All data are presented as mean ± SEM, and fold changes in a)–d) are relative to untreated controls. Data were analyzed using Student's t-test. Bars showing statistically significant values compared to controls are marked by asterisks. *P < 0.5; **P < 0.01; and ****P < 0.0001.

Similar articles

Cited by

References

    1. Akerfelt M, Morimoto RI, Sistonen L. 2010. Heat shock factors: integrators of cell stress, development and lifespan. Nat Rev Mol Cell Biol. 11(8):545–555. doi:10.1038/nrm2938. - DOI - PMC - PubMed
    1. Altun ZF, Hall DH. 2009. Introduction. In: Altun ZF, Herndon LA, Wolkow CA, Crocker C, Lints R, Hall DH, editors. WormAtlas. doi:10.3908/wormatlas.1.1. - DOI
    1. Amrit FR, Ratnappan R, Keith SA, Ghazi A. 2014. The C. elegans lifespan assay toolkit. Methods. 68(3):465–475. doi:10.1016/j.ymeth.2014.04.002. - DOI - PubMed
    1. Anderson JL, Morran LT, Phillips PC. 2010. Outcrossing and the maintenance of males within C. elegans populations. J Hered. 101(Supplement 1):S62–S74. doi:10.1093/jhered/esq003. - DOI - PMC - PubMed
    1. Baer CF, Phillips N, Ostrow D, Avalos A, Blanton D, Boggs A, Keller T, Levy L, Mezerhane E. 2006. Cumulative effects of spontaneous mutations for fitness in Caenorhabditis: role of genotype, environment and stress. Genetics. 174(3):1387–1395. doi:10.1534/genetics.106.061200. - DOI - PMC - PubMed

Publication types

MeSH terms

LinkOut - more resources