. 2025 May 14;16(5):e0331824.
doi: 10.1128/mbio.03318-24. Epub 2025 Apr 2.

Generation of inositol polyphosphates through a phospholipase C-independent pathway involving carbohydrate and sphingolipid metabolism in Trypanosoma cruzi

Affiliations

Generation of inositol polyphosphates through a phospholipase C-independent pathway involving carbohydrate and sphingolipid metabolism in Trypanosoma cruzi

Mayara S Bertolini et al. mBio. .

Abstract

Inositol phosphates are involved in a myriad of biological roles and activities such as Ca2+ signaling, phosphate homeostasis, energy metabolism, and disease pathogenicity. In Saccharomyces cerevisiae, synthesis of inositol phosphates occurs through the phosphoinositide phospholipase C (PLC)-catalyzed hydrolysis of phosphatidylinositol 4,5-bisphosphate (PIP2) into inositol 1,4,5-trisphosphate (IP3) and diacylglycerol and further IP3 phosphorylation by additional kinases that leads to the formation of highly phosphorylated inositol derivatives, known as inositol pyrophosphates. Inositol-tetrakisphosphate 1-kinase (ITPK1) is an enzyme that mediates a PLC-independent inositol polyphosphate synthesis through phosphorylation of inositol monophosphates and other intermediates in the cytosol. In this work, we identified and characterized a Trypanosoma cruzi ITPK1 (TcITPK1) homolog. The ability of TcITPK1 to act as the mediator for this alternative pathway was established through plc1Δ and plc1Δ isc1Δ yeast complementation assays and SAX-HPLC analyses of radioactively labeled inositol. TcITPK1 localizes to the cytosol, and knockout attempts of TcITPK1 revealed that only one allele was replaced by the DNA donor cassette at the specific locus, suggesting that null alleles may have lethal effects in epimastigotes. Ablation of T. cruzi phosphoinositide phospholipase C 1 (TcPI-PLC1) affected the synthesis of IP3 from glucose 6-phosphate but did not affect the synthesis of inositol polyphosphates, while ablation of inositol phosphosphingolipid phospholipase (TcISC1) affected the synthesis of inositol polyphosphates, thus revealing that the PLC-independent pathway using either glucose 6-phosphate or inositol phosphoceramide is involved in the synthesis of inositol polyphosphates, while the PLC-dependent pathway is involved in IP3 formation needed for Ca2+ signaling.

Importance: Millions of people are infected with Trypanosoma cruzi, and the current treatment is not satisfactory. Inositol pyrophosphates have been established as important signaling molecules. Our work demonstrates the presence of a phospholipase C-independent pathway for the synthesis of inositol pyrophosphates in T. cruzi. Furthermore, we demonstrate that this pathway starts with the synthesis of inositol monophosphates from glucose 6-phosphate or from inositol phosphoceramide, linking it to carbohydrate and sphingolipid metabolism. The essentiality of the pathway for the survival of T. cruzi infective stages makes it an ideal drug target for treating American trypanosomiasis.

Keywords: Trypanosoma cruzi; inositol phosphoceramide; inositol pyrophosphates; phospholipase C; sphingolipids.


Conflict of interest statement

The authors declare no conflict of interest.

Figures

Fig 1
Fig 1
Synthesis of inositol pyrophosphates. Phosphatidylinositol (PI) is phosphorylated by a PI kinase (PIK) to form phosphatidylinositol phosphate (PI-4-P or PIP), and a PIP kinase (PIPK) generates phosphatidylinositol 4,5-bisphosphate (PIP2). A phospholipase C (PLC) catalyzes the formation of inositol 1,4,5-trisphosphate (IP3) from PIP2 via the lipid route. IP3 is further converted into inositol polyphosphates through kinase reactions catalyzed by inositol phosphate multikinase (IPMK), which forms inositol tetrakisphosphate (IP4) and inositol pentakisphosphate (IP5); inositol pentakisphosphate kinase (IPPK), which forms inositol hexakisphosphate (IP6); and inositol hexakisphosphate kinase (IP6K), which forms diphosphoinositol pentakisphosphate (IP7) and possibly bis-diphosphoinositol tetrakisphosphate (IP8). Alternative routes (cytosolic routes) start with the conversion of glucose 6-phosphate to inositol 3-phosphate (3-IP1) by inositol-3-phosphate synthase (INO1), followed by kinase reactions catalyzed by inositol tetrakisphosphate 1-kinase (ITPK1), or start with the formation of inositol 1-phosphate (1-IP1) from inositol phosphoceramide (IPC) by inositol sphingolipid phospholipase C-like protein (ISCL), with further kinase reactions by ITPK1. Note that PLC produces inositol 1,4,5-trisphosphate, while the alternative pathways likely produce inositol 1,3,4-trisphosphate. The enzyme that catalyzes the conversion of IP7 into IP8 (blue) in T. cruzi is unknown. The pathway that converts IPC into 1-P1 and ceramide (orange) is present in T. cruzi but absent in mammals.
Fig 2
Fig 2
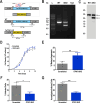
CRISPR/Cas9 endogenous C-terminal tagging of TcITPK1. (A) Schematic representation of the wild-type and endogenous tagged TcITPK1 gene. Epimastigotes were endogenously tagged with a 3×c-Myc tag using CRISPR/Cas9 genome editing. (B) PCR analysis for validation of TcITPK1 tagging showing expected bands for control cell lines (predicted size, 228 bp) and TcITPK1-3×c-Myc cell line (predicted size, 1,509 bp). Lanes: L, 1 kb plus ladder; WT, wild-type; ITPK Myc#1, TcITPK1-3×c-Myc#1; ITPKMyc#2, TcITPK1-3×c-Myc #2; H2O, PCR negative control. Clone#1 was selected for further study as clone#2 was smaller. (C) Western blot analysis of wild-type and TcITPK1-3×c-Myc epimastigotes using the monoclonal antibody against c-Myc tag. The predicted protein molecular mass for TcITPK1-3×c-Myc is 50.9 kDa. Molecular markers are on the left. Tubulin was used as a loading control. (D) Localization of endogenously tagged TcITPK1-3×c-Myc in epimastigotes using anti-c-Myc antibodies. DIC, differential interference contrast. c-Myc (green), TcITPK1-3×c-Myc. The merge image shows TcITPK1-3×c-Myc (green) and DAPI staining (blue). Scale bar = 5  µm.
Fig 3
Fig 3
TcITPK1 or HsITPK complementation in yeast. (A) Growth of S. cerevisiae wild-type (BY4741), PLC1-ablated (plc1Δ), and PLC1- and ISC1-ablated (plc1Δ isc1Δ) transformed with the empty vector pCA45 (pEMPTY), pCA45-HsITPK1, pCA45-TcITPK1, pCA45-TcITPK1-H198A, or pCA45-TcITPK1-K242A plasmids. Yeast cultures were adjusted to OD600 = 10 and spotted onto the SC-URA solid medium with or without myo-inositol along with four 10-fold serial dilutions. (B and C) Growth of S. cerevisiae wild-type (BY4741), PLC1-ablated (plc1Δ), and PLC1- and ISC1-ablated (plc1Δ isc1Δ) transformed with pCA45 (pEMPTY), pCA45-HsITPK1, or pCA45-TcITPK1 in liquid SC-URA medium with (B) or without (C) myo-inositol starting at an OD600 of 0.1 was monitored every 30 minutes for a total period of 40 hours. Values are expressed as means ± S.D. (n = 3). ***P ≤ 0.001 and ****P ≤ 0.0001 by one-way ANOVA with Tukey’s multiple comparisons test. Blue asterisks = pEMPTY vs HsITPK1; red asterisks = pEMPTY vs TcITPK1. (D) SAX-HPLC analysis of IPs from the [3H]inositol-labeled wild-type yeast strain transformed with pEMPTY (pCA45, black line), pCA45-HsITPK1 (blue line), or pCA45-TcITPK1 (red line). (E) SAX-HPLC analysis of IPs from the [3H]inositol-labeled PLC1-ablated (plc1Δ) yeast strain transformed with pEMPTY (pCA45, black line), pCA45-HsITPK1 (blue line), pCA45-TcITPK1 (red line), pCA45-TcITPK1-H198A (green line), or pCA45-TcITPK1-K242A (yellow line). (F) SAX-HPLC analysis of IPs from the [3H]inositol-labeled PLC1- and ISC1-ablated (plc1Δ isc1Δ) yeast strains transformed with pEMPTY (pCA45, black line), pCA45-HsITPK1 (blue line), or pCA45-TcITPK1 (red line).
Fig 4
Fig 4
Single-gene knockout of TcITPK1. (A) Schematic representation of the strategy used to generate a TcITPK1-SKO mutant by homologous recombination and primers (arrows) used to verify gene replacement by PCR. The intact locus generates a PCR product of 1,517 bp, while the disrupted locus generates a fragment of 857  bp. (B) PCR analysis showing that a single gene of TcITPK1 was ablated at its genomic locus and replaced in genomic DNA of the SKO cell line. Lanes: L, 1 kb plus ladder; WT, wild type; SKO, TcITPK1-SKO; H2O, PCR negative control. (C) Southern blot analysis of wild-type and TcITPK1-SKO (SKO) gDNA digested with the PvuII restriction enzyme. The blot was hybridized with a biotin-labeled probe corresponding to 455 bp of TcITPK1 5’ UTR (nt −729 to −275), revealing a 2,700 bp band for PvuII-digested gDNA from WT cells and a 2,040 bp band for PvuII-digested gDNA from TcITPK1-SKO cells (arrows). (D) Growth of control (scrambled) and TcITPK1-SKO (ITPK1-SKO) epimastigotes in the LIT medium. (E) Percentage of metacyclic trypomastigotes in epimastigote cultures after incubation in the TAU 3AAG medium. Differentiation of epimastigotes to metacyclic trypomastigotes was quantified by staining with DAPI to distinguish the position of the kinetoplast by fluorescence microscopy. Values are expressed as means ± SD (n = 3) **P ≤ 0.01 by Student’s t test. (F) TcITPK1-SKO trypomastigote infection of Vero cells at 4 hours post-infection was significantly inhibited. Values are expressed as means ± SD (n = 3) *P ≤ 0.05 by Student’s t test. (G) The number of intracellular amastigotes per infected host cell observed 48 hours post-infection was also significantly reduced. Values are expressed as means ± SD (n = 3) ***P ≤ 0.001 by Student’s t test.
Fig 5
Fig 5
TcITPK1 overexpression. (A) Western blot analysis of wild-type and TcITPK1-3×HA epimastigotes using monoclonal antibodies against the HA tag. The predicted protein molecular mass for TcITPK1-3×HA is 49 kDa. Molecular markers are on the left. Tubulin was used as a loading control. (B) Localization of TcITPK1-3×HA in epimastigotes using anti-HA antibodies. DIC, differential interference contrast. HA (green), TcITPK1-3×HA. The merge image shows TcITPK1-3×HA (green) and DAPI staining (blue). Scale bar = 5  µm. (C) Growth of control (EV, empty vector) and TcITPK1-3×HA (ITPK1-OE) epimastigotes in the LIT medium. (D) Percentage of metacyclic trypomastigotes in epimastigote cultures after incubation in the TAU 3AAG medium in the presence or absence of 150 µM IP6. Values are expressed as means ± SD (n = 3) ***P ≤ 0.001 by two-way ANOVA with Dunnett’s multiple-comparison test. (E) TcITPK1-3×HA trypomastigote infection of Vero cells at 4 hours post-infection was not significant. Values are expressed as means ± SD (n = 3) by Student’s t test. (F) The difference in the number of intracellular amastigotes per infected host cell observed 48 hours post-infection was significant. Values are expressed as means ± SD (n = 3) ***P ≤ 0.001 by Student’s t test.
Fig 6
Fig 6
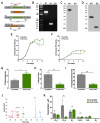
Knockout of TcPI-PLC1. (A) Schematic representation of the strategy used to generate a TcPI-PLC1-KO mutant by homologous recombination and primers (arrows) used to verify gene replacement by PCR. The intact locus generates a PCR product of 2,247 bp, while the disrupted locus generates a fragment of 587  bp. (B) PCR analysis showing that TcPI-PLC1 was ablated at its genomic locus and replaced in genomic DNA of the KO cell line. Lanes: L, 1 kb plus ladder; WT, wild-type; KO, TcPI-PLC1-KO; H2O, PCR-negative control. (C) Southern blot analysis of wild-type and TcPI-PLC1-KO (KO) gDNA digested with the BamHI restriction enzyme. The blot was hybridized with a 32P-labeled probe corresponding to 439 bp of TcPI-PLC1 (nt +1 to +439), revealing a 4,419-bp band only for BamHI-digested gDNA from WT cells. (D) Southern blot analysis of wild-type and TcPI-PLC1-KO (KO) gDNA digested with the PvuII restriction enzyme. The blot was hybridized with a 32P-labeled probe corresponding to 460 bp of TcPI-PLC1 5’ UTR (nt −503 to −1), revealing a 1,628-bp band for PvuII-digested gDNA from WT cells and a 715 bp band for PvuII-digested gDNA from TcPI-PLC1-KO cells. (E) Growth of control (scrambled) and TcPI-PLC1-KO (PI-PLC1-KO) epimastigotes in the LIT medium. Values are expressed as means ± SD (n = 3) *P ≤ 0.05 by Student’s t test. (F) Growth of control (scrambled) and TcPI-PLC1-KO (PI-PLC1-KO) epimastigotes in low-glucose LIT medium. Values are expressed as means ± SD (n = 3) **P ≤ 0.01 by Student’s t test. (G) Percentage of metacyclic trypomastigotes in epimastigote cultures after incubation in the TAU 3AAG medium. Values are expressed as means ± SD (n = 3) *P ≤ 0.01 by Student’s t test. (H) TcPI-PLC1-KO trypomastigote infection of Vero cells at 4 hours post-infection was significantly reduced. Values are expressed as means ± SD (n = 3) **P ≤ 0.01 by Student’s t test. (I) The number of intracellular amastigotes per infected host cell observed 48 hours post-infection was also significantly reduced. Values are expressed as means ± SD (n = 3) ***P ≤ 0.001 by Student’s t test. (J, K) Inositol phosphate extraction from scrambled and TcPI-PLC1-KO (PI-PLC1-KO) parasites, followed by CE-ESI-MS analysis, enables the identification of several important inositol phosphate and pyrophosphate isomers. (J) Separation of inositol phosphates by CE-ESI-MS from a TcPI-PLC1-KO sample. Black line: extracted ion electropherograms of [13C6] 1–5-IP8, 5-IP7, 1/3-IP7, and IP6 references; pink line: extracted electropherograms of IP8 in the sample; red line: extracted ion electropherograms of IP7 in the sample; green line: extracted ion electropherograms of IP6 in the sample; blue trace: extracted ion electropherograms of IP3 in the sample. (K) Concentration of inositol phosphates in scrambled and TcPI-PLC1-KO (PI-PLC1-KO) cells by CE-ESI-MS analysis shows that synthesis of IP6 and IP7 persists in TcPI-PLC1-KO epimastigotes. Values are expressed as means ± SD (n > 3) *P ≤ 0.01; **P ≤ 0.01 by Student’s t test.
Fig 7
Fig 7
Glucose labeling for inositol phosphate detection. (A) Metabolic labeling was performed by cultivating T. cruzi epimastigotes at an initial density of 2 × 10⁶ cells/mL in low-glucose LIT medium (no added glucose) for 48 hours. After this period, the parasites were harvested by centrifugation and resuspended in fresh LIT medium containing either 10 mM ¹³C-labeled D-glucose or 10 mM unlabeled D-glucose. The cultures were incubated for an additional 48 hours. Subsequently, the cells were harvested by centrifugation for inositol phosphate extraction and LC-MS analysis. Values are expressed as means ± SD (n > 3) *P ≤ 0.05; ****P ≤ 0.0001 by Student’s t test.
Fig 8
Fig 8
Knockout of TcISC1. (A) Schematic representation of the strategy used to generate a TcISC1-KO mutant by homologous recombination and primers (arrows) used to verify gene replacement by PCR. The intact locus generates a PCR product of 455 bp, while the disrupted locus does not generate a fragment. (B) PCR analysis showing that TcISC1 was ablated at its genomic locus and replaced in genomic DNA of the KO cell line. Lanes: L, 1 kb plus ladder; WT, wild-type; KO, TcISC1-KO; H2O, PCR-negative control. (C) Southern blot analysis of wild-type and TcISC1-KO (KO) gDNA digested with the PvuII restriction enzyme. The blot was hybridized with a biotin-labeled probe corresponding to 435 bp of TcISC1 (nt +694 to +1,128), revealing a 1,295-bp band only for PvuII-digested gDNA from WT cells. (D) Growth of control (scrambled) and TcISC1-KO (ISC1-KO) epimastigotes in the LIT medium. Values are expressed as means ± SD (n = 3) *P ≤ 0.05 by Student’s t test. (E) Percentage of metacyclic trypomastigotes in epimastigote cultures after incubation in the TAU 3AAG medium. Values are expressed as means ± SD (n = 3) by Student’s t test. (F) PAGE analysis of IP6 and IP6 extracts from scrambled and TcISC1-KO epimastigotes. Half of the samples were treated with phytase (0.1 mg/mL, pH 5.0, at 37°C for 1 hours) to confirm that the bands correspond to IP6. (G) Densitometry of toluidine-stained IP6 from scrambled and TcISC1-KO. Values are expressed as means ± SD (n = 3) *P ≤ 0.05 by Student’s t test.
Fig 9
Fig 9
CRISPR/Cas9 endogenous C-terminal tagging and overexpression of TcISC1. (A) Schematic representation of the wild-type and endogenous tagged TcISC1 gene. Epimastigotes were endogenously tagged with a 3×c-Myc tag using CRISPR/Cas9 genome editing. (B) PCR analysis for validation of TcISC1 tagging showing expected bands for control cell lines (WT, predicted size, 455 bp) and TcISC1-3×c-Myc cell line (ISC1 Myc, predicted size, 1,738 bp). (C) Western blot analysis of wild-type and TcISC1-3×c-Myc epimastigotes using monoclonal antibodies against c-Myc tag. The predicted protein molecular mass for TcISC1-3×c-Myc was 72 kDa. Molecular markers are on the left. Tubulin was used as a loading control. (D) Localization of endogenously tagged TcISC1-3×c-Myc in epimastigotes using anti-c-Myc antibodies. DIC, differential interference contrast. c-Myc (green), TcISC1-3×c-Myc. BiP (red), endoplasmic reticulum marker. The merge image shows that TcISC1-3×c-Myc (green) colocalizes with BiP (red); Pearson’s correlation coefficient (PCC) = 0.74. Scale bar = 5  µm. (E) Localization of endogenously tagged TcISC1-3×c-Myc in epimastigotes using anti-c-Myc antibodies. DIC, differential interference contrast. c-Myc (green), TcISC1-3×c-Myc. Mitotracker (red), mitochondrial marker. The merge image shows that TcISC1-3×c-Myc (green) colocalizes with Mitotracker (red); PCC = 0.60. Scale bar = 5  µm. (F) Western blot analysis of wild-type and TcISC1-3×HA epimastigotes using monoclonal antibodies against the HA tag. The predicted protein molecular mass for TcISC1-3×HA is 69 kDa. Molecular markers are on the left. Tubulin was used as a loading control. (G) Growth of control (EV, empty vector) and TcISC1-3×HA (ISC1-OE) epimastigotes in the LIT medium. (H) Localization of TcISC1-3×HA in epimastigotes using anti-HA antibodies. DIC, differential interference contrast. HA (green), TcISC1-3×HA. BiP (red), endoplasmic reticulum marker. The merge image shows that TcISC1-3×HA (green) colocalizes with BiP (red); PCC = 0.67. Scale bar = 5  µm. (I) Localization of TcISC1-3×HA in epimastigotes using anti-HA antibodies. DIC, differential interference contrast. HA (green), TcISC1-3×HA. Mitotracker (red), mitochondrial marker. The merge image shows that TcISC1-3×HA (green) colocalizes with Mitotracker (red); PCC = 0.76. Scale bar = 5  µm.

Similar articles

References

    1. Gómez-Ochoa SA, Rojas LZ, Echeverría LE, Muka T, Franco OH. 2022. Global, regional, and national trends of chagas disease from 1990 to 2019: comprehensive analysis of the global burden of disease study. Glob Heart 17:59. doi:10.5334/gh.1150 - DOI - PMC - PubMed
    1. Keeling PJ, Burki F. 2019. Progress towards the tree of eukaryotes. Curr Biol 29:R808–R817. doi:10.1016/j.cub.2019.07.031 - DOI - PubMed
    1. Wilson MSC, Livermore TM, Saiardi A. 2013. Inositol pyrophosphates: between signalling and metabolism. Biochem J 452:369–379. doi:10.1042/BJ20130118 - DOI - PubMed
    1. Einicker-Lamas M, Almeida AC, Todorov AG, de Castro SL, Caruso-Neves C, Oliveira MM. 2000. Characterization of the myo-inositol transport system in trypanosoma cruzi. Eur J Biochem 267:2533–2537. doi:10.1046/j.1432-1327.2000.01302.x - DOI - PubMed
    1. Einicker-Lamas M, Nascimento MTC, Masuda CA, Oliveira MM, Caruso-Neves C. 2007. Trypanosoma cruzi epimastigotes: regulation of myo-inositol transport by effectors of protein kinases A and C. Exp Parasitol 117:171–177. doi:10.1016/j.exppara.2007.04.011 - DOI - PubMed

MeSH terms

LinkOut - more resources