. 2025 May 20;99(5):e0035225.
doi: 10.1128/jvi.00352-25. Epub 2025 Apr 2.

Type II grass carp reovirus utilizes autophagosomes for viroplasm formation and subclinical persistent infection

Affiliations

Type II grass carp reovirus utilizes autophagosomes for viroplasm formation and subclinical persistent infection

Qian Wang et al. J Virol. .

Abstract

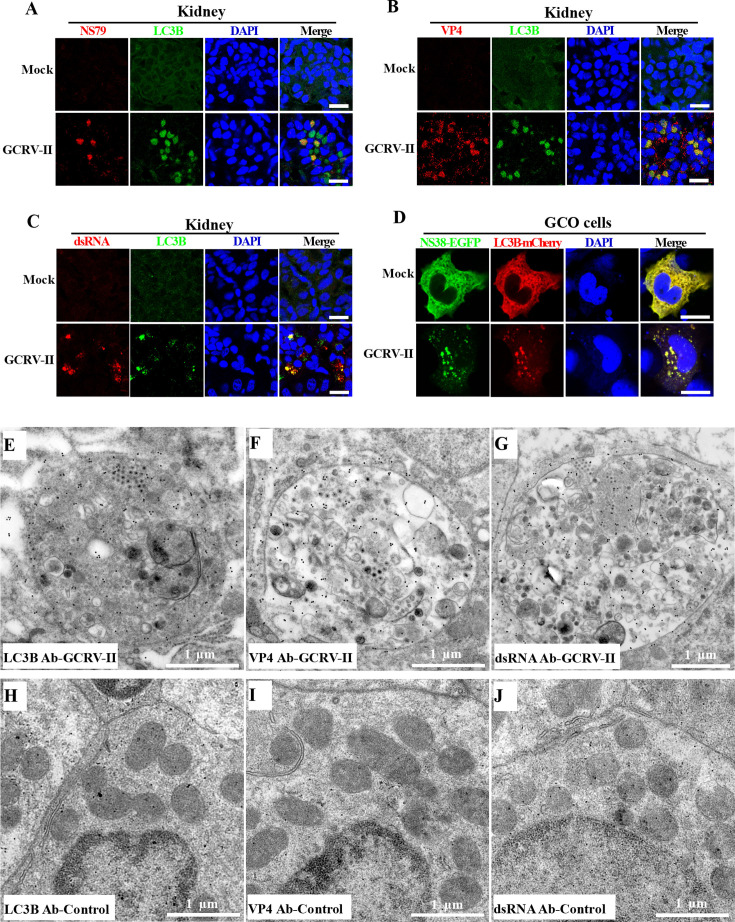
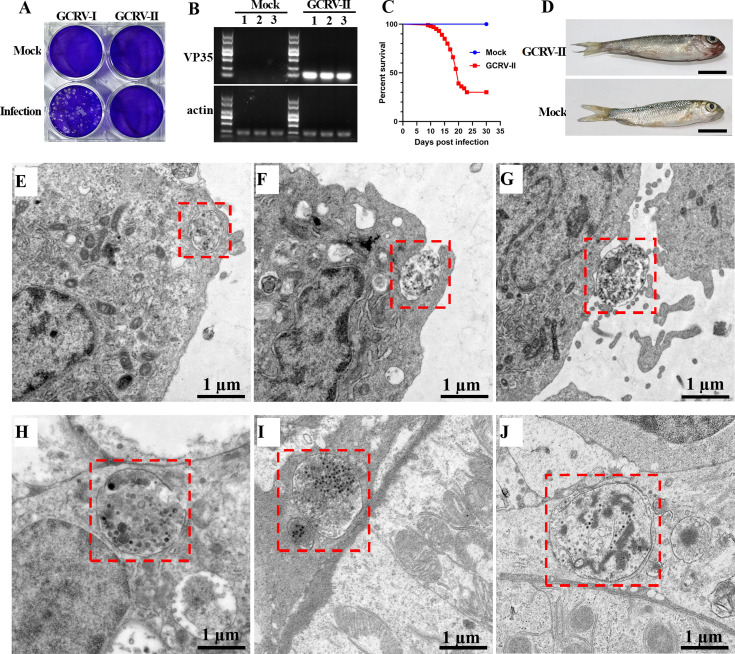
Grass carp reovirus (GCRV) is the most virulent pathogen within the genus Aquareovirus, belonging to the family Spinareoviridae. GCRV is categorized into three genotypes, with type II (GCRV-II) being the predominant strain circulating in China. Reoviruses are known to replicate and assemble in cytoplasmic inclusion bodies termed viroplasms; however, information regarding the formation of GCRV-II viroplasms and their specific roles in virus infection remains largely unknown. In this study, we investigated the formation and characteristics of viroplasms during GCRV-II infection. Immunofluorescence and confocal microscopy indicate that GCRV-II infection induces the formation of viroplasms, with the nonstructural protein NS79 being the key protein responsible for this process. Live-cell imaging and fluorescence recovery after photobleaching assays reveal that GCRV-II viroplasms lack liquid-like properties. Transmission electron microscopy confirms that GCRV-II viroplasms are membranous structures. Notably, we demonstrate that GCRV-II infection induces autophagy and the formation of autophagosomes and that GCRV-II utilizes these autophagosomes for viroplasm formation and virion assembly. Furthermore, we found that GCRV-II uses autophagosomes to evade the host immune system, establishing subclinical persistent infection. GCRV-II also employs autophagosomes for nonlytic release and viral spread. Collectively, these findings highlight distinctive characteristics of GCRV-II viroplasms compared to those of other animal reoviruses, offering valuable insights for the prevention and control of this virus.IMPORTANCEGrass carp reovirus (GCRV) is categorized into three genotypes, with GCRV-II being the most prevalent in China. Despite reoviruses being known for their replication and assembly in viroplasms, the specifics of GCRV-II viroplasm formation and its role in infection were unclear. Our study demonstrates that GCRV-II infection triggers the formation of viroplasms, primarily mediated by the nonstructural protein NS79. GCRV-II viroplasms are membranous structures that lack liquid-like properties, which are significantly different from the viroplasms of other reoviruses. Notably, our research unveils that GCRV-II infection induces autophagy and utilizes autophagosomes for viroplasm formation and virion assembly. Furthermore, we also confirm that GCRV-II utilizes autophagosomes for subclinical persistent infection, nonlytic release, and viral spread. Our results indicate that GCRV-II hijacks autophagosomes to form viroplasms and complete its life cycle. The characteristics of GCRV-II are significantly different from those of other animal reoviruses, providing important information for prevention and control of this virus.

Keywords: autophagosomes; autophagy; nonlytic release; nonstructural protein NS79; subclinical persistent infection; type II grass carp reovirus; viral spread; viroplasms.


Conflict of interest statement

The authors declare no conflict of interest.

Figures

Fig 1
Fig 1
GCRV-II infection induces the formation of viroplasms. (A–C) Immunofluorescence analysis of kidney samples from GCRV-II-infected fish by using antibodies against N79 (A), VP4 (B), or dsRNA (C), respectively. Grass carp were mock-infected or infected with GCRV-II, and the kidney samples were collected for immunofluorescence analysis. Scale bar = 10 µm. (D) Immunofluorescence analysis of GCRV-II GCO cells using antibodies against NS79. GCO cells were mock-infected or infected with GCRV-II and then stained with anti-NS79 antibody. Scale bar = 10 µm. (E, F) The localization patterns of NS38-EGFP (E) and NS38-mCherry (F) in the absence or presence of GCRV-II infection. GCO cells were transfected with NS38-EGFP or NS38-mCherry plasmids and then mock-infected or infected with GCRV-II and harvested for fluorescence observation. Scale bar = 10 µm.
Fig 2
Fig 2
NS79 is responsible for GCRV-II viroplasm formation. (A, B) The localization patterns of all GCRV-II-encoded proteins. GCO cells were transfected with 11 EGFP-tagged (A) or mCherry-tagged (B) viral proteins or empty vector and harvested at 24 hours post-infection for fluorescence observation. Scale bar = 10 µm. (C–L) The relationship between viral NS79-EGFP and other mCherry-tagged viral proteins. NS79-EGFP was co-transfected with other mCherry-tagged viral proteins into GCO cells and harvested at 24 hours post-infection for fluorescence observation. Scale bar = 10 µm.
Fig 3
Fig 3
GCRV-II viroplasms lack liquid-like properties. (A) Investigate the movement of GCRV-I and GCRV-II viroplasms by live-cell imaging. GCO cells were transfected with NS38-EGFP of GCRV-I or GCRV-II and then infected with the corresponding virus and collected at 6 or 12 hours post-infection for live-cell imaging analysis. The red arrows indicate the small viroplasm puncta fusing and merging into larger puncta. Scale bar = 10 µm. (B) FRAP assay of GCRV-I and GCRV-II viroplasms. GCO cells were transfected with NS38-EGFP of GCRV-I or GCRV-II and then infected with the corresponding virus and collected at 6 or 12 hours post-infection for FRAP assay. Data are represented as mean (n = 3) ±SD. Scale bar = 10 µm. (C) Investigate the liquid-like properties of GCRV-I and GCRV-II viroplasms by 1,6-HD treatment. GCO cells were transfected with NS38-EGFP of GCRV-I or GCRV-II and then infected with the corresponding virus and collected at 6 or 12 hours post-infection. Scale bar = 10 µm.
Fig 4
Fig 4
GCRV-II viroplasms are bound by membranes. (A, B) TEM analysis of GCRV-II-infected cells. The red arrows indicate the membranes of viroplasms, while the asterisks indicate the cytosolic components or organelles. N: nucleus; V: viroplasm; GCRV: the GCRV virions. Scale bar = 2 µm and 500 nm. (C, D) TEM analysis of GCRV-I-infected cells. V: viroplasm; GCRV: the GCRV virions. Scale bar = 2 µm and 500 nm. (E, F) TEM analysis of kidney samples from GCRV-II-infected fish. N: nucleus; V: viroplasm. The red arrows indicate the membranes of viroplasms, the asterisks indicate the cytosolic components or organelles, and the black arrows represent the GCRV-II virions. Scale bar = 2 µm and 1 µm. (G, H) Immunofluorescence analysis of GCRV-I- or GCRV-II-infected cells that permeabilized with either Triton X-100 (G) or digitonin (H). GCO cells were infected with GCRV-I or GCRV-II and then harvested at 24 hpi. Cells permeabilized with either Triton X-100 (G) or digitonin (H) and then stained with anti-NS80 or anti-NS79 antibodies to detect viroplasms. Scale bar = 10 µm.
Fig 5
Fig 5
GCRV-II infection induces autophagy and autophagosome formation. (A) Immunofluorescence analysis of kidney samples from GCRV-II-infected or control fish by using antibodies against LC3B. Scale bar = 10 µm. (B) The localization patterns of LC3B-EGFP in the absence or presence of GCRV-II infection. Scale bar = 10 µm. (C, D) TEM analysis of kidney samples from GCRV-II-infected or control fish. The asterisks indicate autophagosome-like vesicles in GCRV-infected kidney samples. Scale bar = 2 µm. (E) Quantitative analysis of the number of LC3B puncta in mock- or GCRV-II-infected cells. Data are represented as mean (n = 15) ±SD. ** indicates P < 0.01. (F) Quantitative analysis of the number of autophagosome-like vesicles in GCRV-II-infected or control fish. Data are represented as mean (n = 15) ±SD. ** indicates P < 0.01. (G) Western blotting analysis of the protein expression level of LC3B, P62, and LAMP2 in kidney samples from GCRV-II-infected or control fish. (H) Investigation of the process of autophagic flux during GCRV-II infection by using the pCMV-mCherry-GFP-LC3B plasmid. Cells were transfected with this plasmid and then treated with the autophagy inducer rapamycin (Rapa) or the autophagy inhibitor bafilomycin A1 (BafA1) or infected with GCRV-I or GCRV-II. Cells were harvested at 24 hours for fluorescence observation. Scale bar = 10 µm.
Fig 6
Fig 6
GCRV-II utilizes autophagosomes for viroplasm formation and virion assembly. (A–C) Immunofluorescence analysis of the relation between GCRV-II viroplasms and autophagosomes. Grass carp were mock-infected or infected with GCRV-II, and the kidney samples were collected. The autophagosomes were stained with the anti-LC3B antibody, while the viroplasms were stained with anti-NS79, anti-VP4, or anti-dsRNA antibodies. Scale bar = 10 µm. (D) The relationship between viral NS38-EGFP and LC3B-mCherry in the absence or presence of GCRV-II infection. Scale bar = 10 µm. (E–G) Immunoelectron microscopy analysis of kidney samples from GCRV-II-infected fish. The GCRV-II-infected kidney samples were immunolabeled with LC3B (E), VP4 (F), or ds RNA (G) antibodies as the primary antibody, followed by treatment with 10 nm gold particle-conjugated IgG as the secondary antibody. Scale bar = 1 µm. (H–J) Immunoelectron microscopy analysis of kidney samples from control fish. The control kidney samples were immunolabeled with LC3B (H), VP4 (I), or ds RNA (J) antibodies as the primary antibody, followed by treatment with 10 nm gold particle-conjugated IgG as the secondary antibody. Scale bar = 1 µm.
Fig 7
Fig 7
GCRV-II utilizes autophagosomes for subclinical persistent infection. (A) RT-PCR detection of GCRV-II in grass carp from fish farms with or without GCRV exposure history. Eight individuals were collected from each farm for GCRV-II detection by using primers specific for VP35, and β-actin was used as an internal control. (B) Clinical observation of GCRV-II subclinical persistent infected fish and control fish. Scale bar = 1 cm. (C, D) TEM analysis of brain samples from control fish (C) or from GCRV-II subclinical persistent infected fish (D). The red boxes indicate the virions that are enclosed by autophagosome-like vesicles. Scale bar = 1 µm. (E, F) Magnification of virion-contained autophagosome-like vesicles in GCRV-II subclinical persistent infected fish. Scale bar = 500 nm. (G–J) RT-qPCR analysis of the mRNA expression levels of IRF3 (G), IRF7 (H), IFN1 (I), and IFN3 (J) in GCRV-II subclinical persistent infected fish and control fish. Data are represented as mean (n = 5) ±SD. ns indicates no significant difference. (K) Western blotting analysis of the protein expression levels of IRF3 and IRF7 in three GCRV-II subclinical persistent infected fish and in three control fish.
Fig 8
Fig 8
GCRV-II utilizes autophagosomes for non-lytic release and spread. (A) GCRV-II infection did not induce CPE in CIK cells. CIK cells were mock-infected or infected with GCRV-I or GCRV-II and then stained by crystal violet. (B) RT-PCR detection of GCRV-II in mock- or GCRV-II-infected cells. GCRV-II detection was performed by using primers specific for VP35, and β-actin was used as an internal control. (C) Percent of survival in grass carp that were injected with supernatants from GCRV-II-infected or mock-infected cells. (D) Clinical observation of grass carp that were injected with supernatants from GCRV-II (upper)- or mock-infected cells (bottom). Scale bar = 1 cm. (E–G) TEM analysis of GCRV-II-infected cells that were harvested at different time points. The virion-contained autophagosomes were observed at the periphery of cell membranes (E), fused with the cytomembrane (F), or outside the cells (G). Scale bar = 1 µm. (H–J) TEM analysis of kidney samples from GCRV-II-infected fish that were collected at different time points. The virus-containing autophagosomes were observed at the periphery of kidney cell membranes (H), outside the cells (I), or located at the intercellular junctional regions between the kidney cells (J). Scale bar = 1 µm.
Fig 9
Fig 9
Schematic diagram of GCRV-II viroplasm formation and their role during GCRV-II infection. GCRV-II viroplasm formation and virion assembly occur in autophagosomes. GCRV-II utilizes autophagosomes for subclinical persistent infection, non-lytic release, and viral spread.

Similar articles

Cited by

References

    1. Fisheries Bureau of Ministry of Agriculture and Rural Affairs . 2024. China fishery statistical yearbook of 2023. Beijing, China: China Agriculture Press
    1. Rao Y, Su J. 2015. Insights into the antiviral immunity against grass carp (Ctenopharyngodon idella) reovirus (GCRV) in grass carp. J Immunol Res 2015:670437. doi:10.1155/2015/670437 - DOI - PMC - PubMed
    1. Matthijnssens J, Attoui H, Bányai K, Brussaard CPD, Danthi P, del Vas M, Dermody TS, Duncan R, Fāng Q, Johne R, Mertens PPC, Mohd Jaafar F, Patton JT, Sasaya T, Suzuki N, Wei T. 2022. ICTV virus taxonomy profile: Spinareoviridae 2022. J Gen Virol 103:001781. doi:10.1099/jgv.0.001781 - DOI - PubMed
    1. Wang Q, Zeng W, Liu C, Zhang C, Wang Y, Shi C, Wu S. 2012. Complete genome sequence of a reovirus isolated from grass carp, indicating different genotypes of GCRV in China. J Virol 86:12466. doi:10.1128/JVI.02333-12 - DOI - PMC - PubMed
    1. Wang X, Zhang F, Su R, Li X, Chen W, Chen Q, Yang T, Wang J, Liu H, Fang Q, Cheng L. 2018. Structure of RNA polymerase complex and genome within a dsRNA virus provides insights into the mechanisms of transcription and assembly. Proc Natl Acad Sci USA 115:7344–7349. doi:10.1073/pnas.1803885115 - DOI - PMC - PubMed

Substances

LinkOut - more resources