. 2025 Apr 4;11(14):eado0173.
doi: 10.1126/sciadv.ado0173. Epub 2025 Apr 2.

Fibroblast atlas: Shared and specific cell types across tissues

Affiliations

Fibroblast atlas: Shared and specific cell types across tissues

Kaidong Liu et al. Sci Adv. .

Abstract

Understanding the heterogeneity of fibroblasts depends on decoding the complexity of cell subtypes, their origin, distribution, and interactions with other cells. Here, we integrated 249,156 fibroblasts from 73 studies across 10 tissues to present a single-cell atlas of fibroblasts. We provided a high-resolution classification of 18 fibroblast subtypes. In particular, we revealed a previously undescribed cell population, TSPAN8+ chromatin remodeling fibroblasts, characterized by high expression of genes with functions related to histone modification and chromatin remodeling. Moreover, TSPAN8+ chromatin remodeling fibroblasts were detectable in spatial transcriptome data and multiplexed immunofluorescence assays. Compared with other fibroblast subtypes, TSPAN8+ chromatin remodeling fibroblasts exhibited higher scores in cell differentiation and resident fibroblast, mainly interacting with endothelial cells and T cells through ligand VEGFA and receptor F2R, and their presence was associated with poor prognosis. Our analyses comprehensively defined the shared and specific characteristics of fibroblast subtypes across tissues and provided a user-friendly data portal, Fibroblast Atlas.


Figures
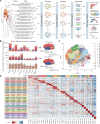
Fig. 1.
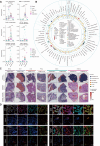
Fig. 1.. Defining fibroblast subtypes from a curated collection of scRNA-seq datasets.
(A) Workflow of data collection and fibroblast analysis in this study. (B) Barplots showing the number of cells, samples, and datasets across tissues (left), with the exact numbers indicated above each bar. Pie charts depicting summary statistics for the fibroblasts and samples (right). (C) t-Distributed stochastic neighbor embedding (t-SNE) visualization of fibroblast clusters. (D) Heatmap showing the relative expression patterns of marker genes in distinct fibroblast clusters. The top bar representing corresponding fibroblast subtypes. See also table S2.
Fig. 2.
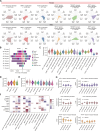
Fig. 2.. Transcriptome heterogeneity of fibroblast subtypes.
(A) t-SNE visualization of fibroblast subtypes. (B) Heatmap showing the top expression of TFs in each fibroblast subtype. (C) Barplot showing the relative proportion of fibroblast subtypes across tissues. (D) t-SNE plot showing the distribution of fibroblast subtypes across sample groups. (E) Volcano plots showing DEGs between adjacent and normal, tumor and normal, and metastasis and normal fibroblasts. The percentage difference represents the difference in the percentage of fibroblasts expressing the gene. Color denotes genes with the log2 fold change > 0.25 and the percentage of fibroblasts expressing the gene > 0.25. (F) Bubble plot showing specific pathways in the adjacent, tumor, and metastatic fibroblasts. The red line denotes statistical significance. FDR, false discovery rate; KEGG, Kyoto Encyclopedia of Genes and Genomes; WP, WikiPathways; Reactome, Reactome Pathway Knowledgebase; PID, Pathway Interaction Database; SIG, Signaling Gateway; BIOCARTA, BioCarta Pathway Database.
Fig. 3.
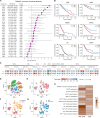
Fig. 3.. Identification of TSPAN8+ chromatin remodeling fibroblast.
(A) Box plots showing cell proportion of six fibroblast subtypes across sample groups. Each point represents a tissue. *P < 0.05; **P < 0.01; ***P < 0.001; ns, no significance. (B) Comparison between our fibroblast subtypes and previously defined fibroblast subtypes. The color intensity of the points represents the statistical significance of gene set enrichment analysis. The color of bars represents the previously defined fibroblast subtypes. The height of the bars denotes the Jaccard index, calculated by the ratio of gene set intersection to the union. TGFβ, transforming growth factor–β. (C) Detection of TSPAN8+ chromatin remodeling fibroblast across six cancer types in spatial transcriptomics. Cell type deconvolution of each spot on the histology image (top). Mapping of fibroblasts (middle) and TSPAN8+ chromatin remodeling fibroblast (bottom) on the same histology image. BRCA, breast carcinoma; GIST, gastrointestinal stromal tumor; LIHC, liver hepatocellular carcinoma; PDAC, pancreatic ductal adenocarcinoma; OSCC, oral squamous cell carcinoma. (D) Immunofluorescence imaging of TSPAN8+ chromatin remodeling fibroblasts in tumor tissues and adjacent tissues of patients diagnosed with colon, breast, ovarian, and pancreatic cancers. TSPAN8 was visualized in green, CAFs were visualized in red, and nuclei were stained in blue. n = 3. Scale bars, 20 μm.
Fig. 4.
Fig. 4.. Differentiation status of fibroblast subtypes.
(A and B) Monocle plot showing the differentiation trajectory colored by fibroblast subtypes (A) and states (B). (C) The number of fibroblasts in each fibroblast subtype. Each point represents a state. (D) The number of fibroblasts in each state. Each point represents a tissue. (E and F) Monocle plot showing the differentiation trajectory colored by EMT scores (E) and CytoTRACE scores (F). (G) Violin plots showing the resident fibroblast scores across states. The Wilcoxon rank-sum test was applied to calculate the P value between different state groups. (H) Heatmap showing the correlation between TFs in different states. The correlation coefficient was calculated by the Pearson correlation analysis.
Fig. 5.
Fig. 5.. Aging and cell senescence characteristics of fibroblast subtypes.
(A) Radar plots showing the preference of six fibroblast subtypes at different age and gender groups. (B) Barplot showing the number of fibroblasts at different age groups. (C) Violin plots showing the cell senescence scores across fibroblast subtypes. The dashed line denotes the average score of fibroblast senescence. (D and E) Violin plots showing the cell senescence scores across sample groups (D) and tissue groups (E). (F) Heatmap showing the correlation between aging and cellular senescence in each fibroblast subtype across tissues. The Pearson correlation analysis was applied to calculate the correlation coefficients and P values. P value: * < 0.05; ** < 0.01; *** < 0.001. (G) Violin plots showing the distribution of senescence scores among different age groups. The statistical significance is calculated using a one-way analysis of variance (ANOVA) test.
Fig. 6.
Fig. 6.. The cell-cell interactions of fibroblast subtypes.
(A) Heatmap showing the interaction strength between two cell types across tissues. The dashed lines were used to separate different cell types. (B) Bubble plot showing the specific ligand-receptor interactions across tissues from six fibroblast subtypes to T cells. (C) Bubble plot showing the expression pattern of selected ligand and receptor genes in six fibroblast subtypes. The size of each bubble represents the fraction of fibroblasts expressing the gene. The color intensity of bubbles represents the scaled expression level of genes. The black line was used to separate the receptor or ligand genes.
Fig. 7.
Fig. 7.. Clinical significance of TSPAN8+ chromatin remodeling fibroblast.
(A) Forest plot showing the univariate Cox analysis of TSPAN8+ chromatin remodeling fibroblast in TCGA pan-cancer data. HR, hazard ratio; CI, confidence interval. (B) Kaplan-Meier survival curves showing the OS difference between the high and low groups with TSPAN8+ chromatin remodeling fibroblast scores in six TCGA cancer types. H, high scoring group; L, low scoring group. (C) Heatmap showing the number of samples between the high and low TSPAN8+ chromatin remodeling fibroblast score groups in 20 ICI data. The color intensity is proportional to the number of samples. Green box represents the statistical significance (P < 0.05). R, responder; NR, nonresponder; H, high scoring group; L, low scoring group; NSCLC, non–small cell lung cancer; KIRC, kidney renal clear cell carcinoma; BLCA, bladder urothelial carcinoma; HNSCC, head and neck squamous cell carcinoma; SKCM, skin cutaneous melanoma. (D) t-SNE visualization of cell types in the single-cell data of colorectal cancer (CRC). (E to G) t-SNE visualization of fibroblasts only, colored by fibroblast subtypes (E), sample types (F), and immunotherapy response types (G), respectively. pCR, pathological complete response; non-pCR, nonpathological complete response. (H) Heatmap showing the enrichment of fibroblast subtypes in immunotherapy response types.

References

    1. Lambrechts D., Wauters E., Boeckx B., Aibar S., Nittner D., Burton O., Bassez A., Decaluwe H., Pircher A., Van den Eynde K., Weynand B., Verbeken E., De Leyn P., Liston A., Vansteenkiste J., Carmeliet P., Aerts S., Thienpont B., Phenotype molding of stromal cells in the lung tumor microenvironment. Nat. Med. 24, 1277–1289 (2018). - PubMed
    1. Plikus M. V., Wang X., Sinha S., Forte E., Thompson S. M., Herzog E. L., Driskell R. R., Rosenthal N., Biernaskie J., Horsley V., Fibroblasts: Origins, definitions, and functions in health and disease. Cell 184, 3852–3872 (2021). - PMC - PubMed
    1. Lavie D., Ben-Shmuel A., Erez N., Scherz-Shouval R., Cancer-associated fibroblasts in the single-cell era. Nat. Cancer 3, 793–807 (2022). - PMC - PubMed
    1. Ohlund D., Handly-Santana A., Biffi G., Elyada E., Almeida A. S., Ponz-Sarvise M., Corbo V., Oni T. E., Hearn S. A., Lee E. J., Chio I. I., Hwang C. I., Tiriac H., Baker L. A., Engle D. D., Feig C., Kultti A., Egeblad M., Fearon D. T., Crawford J. M., Clevers H., Park Y., Tuveson D. A., Distinct populations of inflammatory fibroblasts and myofibroblasts in pancreatic cancer. J. Exp. Med. 214, 579–596 (2017). - PMC - PubMed
    1. Elyada E., Bolisetty M., Laise P., Flynn W. F., Courtois E. T., Burkhart R. A., Teinor J. A., Belleau P., Biffi G., Lucito M. S., Sivajothi S., Armstrong T. D., Engle D. D., Yu K. H., Hao Y., Wolfgang C. L., Park Y., Preall J., Jaffee E. M., Califano A., Robson P., Tuveson D. A., Cross-species single-cell analysis of pancreatic ductal adenocarcinoma reveals antigen-presenting cancer-associated fibroblasts. Cancer Discov. 9, 1102–1123 (2019). - PMC - PubMed

LinkOut - more resources