. 2025 Jul;211(7):1294-1297.
doi: 10.1164/rccm.202409-1816RL.

Clinician Prediction of Hyperinflammatory Acute Respiratory Distress Syndrome Subphenotypes: Overestimated but Prognostic

Collaborators, Affiliations

Clinician Prediction of Hyperinflammatory Acute Respiratory Distress Syndrome Subphenotypes: Overestimated but Prognostic

Georgios D Kitsios et al. Am J Respir Crit Care Med. 2025 Jul.
No abstract available


Conflict of interest statement

GDK has received research funding from Karius, Inc., Pfizer, Inc., and Genentech, Inc. All other authors disclosed no conflict of interest.

Figures
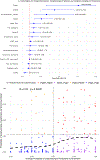
Figure 1:
Figure 1:
Predictors of Consensus Hyperinflammatory Subphenotype Prediction by Reviewers (A) and Correlation of Probabilities Between Consensus Reviewer Predicted and Biomarker-Model Observed Subphenotypes (B). A: Forest plot of odds ratios for prediction of hyperinflammatory subphenotype with 95% confidence intervals for clinical and laboratory variables available to reviewers at the time of the consensus meetings. For the ARDS and “non-pulmonary sepsis” variables, reviewers were asked whether each patient’s presentation was consistent with the diagnosis of ARDS or non-pulmonary sepsis during the consensus meeting but prior to the survey question about prediction of hyper- vs. hypoinflammatory subphenotype. Variables with odds ratios greater than 1 are associated with increased odds of reviewer prediction of the hyperinflammatory subphenotype. The strongest effect sizes were observed for extracorporeal membrane oxygenation (ECMO) support, ARDS and non-pulmonary sepsis diagnosis, and shock requiring vasopressors, whereas diagnosis of chronic obstructive pulmonary disease (COPD) was associated with lower odds of hyperinflammatory subphenotype prediction. B. Scatter plot of predicted probabilities by consensus reviewer average scores for hyperinflammatory subphenotype predictions (x-axis) vs. observed probabilities by the parsimonious logistic regression model by Sinha et al, utilizing IL-6, sTNFR1 and bicarbonate levels (y-axis). A vertical dotted line shows the threshold probability (>0.5) used to classify patients as hyperinflammatory by the consensus predictions, whereas a horizontal dotted line shows the threshold probability used by the Sinha model for subphenotype classification (>0.274). Observations in each quadrant (concordant and discordant) are color coded according to the displayed label. A Locally Estimated Scatterplot Smoothing (loess) regression line is shown by a dashed black line, with an overall weak correlation between predicted and observed subphenotype classification probabilities (r=0.23, p=0.0002). Abbreviations: ECMO: extracorporeal membrane oxygenation; COPD: chronic obstructive pulmonary disease; ARDS: acute respiratory distress syndrome; HR: heart rate; bpm: beats per minute; WBC: white blood cell count.
Figure 2:
Figure 2:
Confusion Matrix of Predicted and Observed Subphenotypes (A) and 30-day Mortality Rates by Predicted-Observed Subphenotype Pairs (B). A. The confusion matrix compares predicted subphenotypes by reviewers (rows) with biomarker-model observed subphenotypes (columns), with the predicted subphenotypes considered the index diagnostic test and the observed subphenotypes as the reference. Diagnostic performance statistics indicate overall poor to fair accuracy. B. Bar plot showing 30-day mortality rates for each predicted-observed subphenotype pair, color-coded according to the confusion matrix. Within each bar, we display the increased predicted mortality from the marginal probabilities (and corresponding 95% confidence interval and p-values) obtained from a logistic regression model for 30-day mortality, using the concordant Hypo-Hypo group as the reference. Abbreviations: TP: true positive; FP: false positive; FN: false negative; TN: true negative; PPV: positive predictive value; NPV: negative predictive value.

References

    1. Sinha P, Meyer NJ, Calfee CS. Biological phenotyping in sepsis and acute respiratory distress syndrome. Annu Rev Med 2023;74:457–471. - PMC - PubMed
    1. Drohan CM, Nouraie SM, Bain W, Shah FA, Evankovich J, Zhang Y, Morris A, McVerry BJ, Kitsios GD. Biomarker-Based Classification of Patients With Acute Respiratory Failure Into Inflammatory Subphenotypes: A Single-Center Exploratory Study. Crit Care Explor 2021;3:e0518. - PMC - PubMed
    1. Kitsios GD, Yang L, Manatakis DV, Nouraie M, Evankovich J, Bain W, Dunlap DG, Shah F, Barbash IJ, Rapport SF, Zhang Y, DeSensi RS, Weathington NM, Chen BB, Ray P, Mallampalli RK, Benos PV, Lee JS, Morris A, McVerry BJ. Host-Response Subphenotypes Offer Prognostic Enrichment in Patients With or at Risk for Acute Respiratory Distress Syndrome. Crit Care Med 2019;47:1724–1734. - PMC - PubMed
    1. Heijnen NFL, Hagens LA, Smit MR, Cremer OL, Ong DSY, van der Poll T, van Vught LA, Scicluna BP, Schnabel RM, van der Horst ICC, Schultz MJ, Bergmans DCJJ, Bos LDJ. Biological Subphenotypes of Acute Respiratory Distress Syndrome Show Prognostic Enrichment in Mechanically Ventilated Patients without Acute Respiratory Distress Syndrome. Am J Respir Crit Care Med 2021;203:1503–1511. - PubMed
    1. Sinha P, Churpek MM, Calfee CS. Machine learning classifier models can identify acute respiratory distress syndrome phenotypes using readily available clinical data. Am J Respir Crit Care Med 2020;202:996–1004. - PMC - PubMed

LinkOut - more resources