. 2025 Apr 3;392(13):1297-1309.
doi: 10.1056/NEJMoa2405333.

The Genetic Architecture of Congenital Diarrhea and Enteropathy

Affiliations

The Genetic Architecture of Congenital Diarrhea and Enteropathy

Zeenat Gaibee et al. N Engl J Med. .

Abstract

Background: Next-generation sequencing has enabled precision therapeutic approaches that have improved the lives of children with rare diseases. Congenital diarrhea and enteropathies (CODEs) are associated with high morbidity and mortality. Although treatment of these disorders is largely supportive, emerging targeted therapies based on genetic diagnoses include specific diets, pharmacologic treatments, and surgical interventions.

Methods: We analyzed the exomes or genomes of infants with suspected monogenic congenital diarrheal disorders. Using cell and zebrafish models, we tested the effects of variants in newly implicated genes.

Results: In our case series of 129 infant probands with suspected monogenic congenital diarrheal disorders, we identified causal variants, including a new founder NEUROG3 variant, in 62 infants (48%). Using cell and zebrafish models, we also uncovered and functionally characterized three novel genes associated with CODEs: GRWD1, MYO1A, and MON1A.

Conclusions: We have characterized the broad genetic architecture of CODE disorders in a large case series of patients and identified three novel genes associated with CODEs. (Funded by the National Institutes of Health and others.).


Figures

Figure 1.
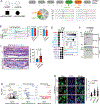
Figure 1.. The Genetic Architecture of CODE.
A. Patient flow diagram showing DNA sequencing and single bioinformatics pipeline and variant annotation with quality control processes. B. CODE genes identified in PediCODE Consortium patients.
Figure 2.
Figure 2.. Genetic and Functional Studies of GRWD1 Variants.
A. Trio WES identified biallelic variants in GRWD1 in two CODE probands. Pedigree is on the left, and cartoon depiction of the seven WD40 repeats of GRWD1 and amino acid conservation across species of the 2 variants identified in 2 CODE probands (hu, human; mo, mouse; zf, zebrafish; dm, Drosophila melanogaster; ce, Caenorhabditis elegans; sc, Saccharomyces cerevisiae). Alignments generated by clustalo; (*) conserved residues; (:) strongly similar residues; (.) weakly similar residues. B. Representative bright-field images of wt (N = 12) and grwd1 crispants (N = 10). Body length and gut length were quantitated by Fiji. Statistical differences were determined by Student’s t-test. Mean ± SD. C. Gut morphology of wt and grwd1 zebrafish crispants: Representative images of wt and grwd1 crispant zebrafish at 8 dpf with H&E and alcian blue staining, N = 6. The area of each goblet cell was measured using the Fiji selection tool to draw region of interest (N = 30). Statistical differences were determined by Student’s t-test. Mean ± SD. D. Volcano plot comparing RNA-sequencing data between wt and grwd1 crispants at 8 dpf (N = 15 pooled larvae/group, duplicated, GRCz11 annotation, DESeq2 Wald, adjusted p = 0.01). All genes and subsets of differentially expressed ribosomal protein and p53-signaling genes are displayed. E. ProHits-viz Dot Plot diagram depicting BioID data for select proximity interactors of the WT and CODE variant GRWD1 proteins. Dot size indicates relative abundance of each interacting partner detected across each of the three “bait” proteins. Dot shade indicates total peptide counts detected for each interactor, and the shade of the ring surrounding each dot (blue to black) indicates the confidence level (Bayesian False Discovery Rate) of each indicated bait-prey interaction. Interactors grouped by functional annotation, as indicated. For statistical analysis, a Bayesian FDR was assigned to identified proteins using SAINT (v3.6.1; 20 BirA*Flag-only controls compressed to 4). F. HEK293 T cells were transfected with either Flag-BirA* alone or a Flag-BirA* tagged GRWD1 protein (WT or CODE variant, as indicated). Flag-tagged proteins were precipitated with Flag Agarose Affinity Gel and eluates analyzed by western blotting, using antibodies directed against the Flag epitope or the RPL3 protein. Data are representative of 3 independent experiments. G. Hela cells expressing Flag-BirA*- GRWD1 WT, H307R, or V368F proteins were fixed and stained for Flag epitope (green) and DAPI (blue). Scale bar 10μm. GRWD1 cytosol/nucleus signal ratio was calculated using Volocity. Statistical differences were determined by Student’s t-test. Error bars represent SD from 3 independent experiments, with >70 cells analyzed.
Figure 3.
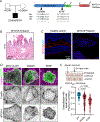
Figure 3.. Genetic and Functional Studies of MYO1A Variants.
A. Trio WES identified biallelic variants in MYO1A in a CODE proband. Pedigree is on the left, and a schematic illustration of the protein domain architecture is on the right, highlighting the amino acid change and its conservation across species: human (hu), mouse (mo), zebrafish (zf), and chicken (ch). IQ = IQ Motif, TH = Tail Homology. B. Hematoxylin and eosin staining of intestinal biopsy from the proband. C. Immunofluorescence images for healthy control and MYO1A-I678F proband tissue showing MYO1A (red) and DAPI (blue). D. Maximum intensity projections of confocal volumes showing localization of wild-type (WT), D240N, and I678F variants of EGFP-MYO1A (green) in CACO-2BBE cells, fixed and stained with phalloidin to highlight F-actin (magenta). Top row shows two-channel merge images; inverted single channel images for EGFP and phalloidin are shown beneath each merge. Scale bars, 30 μm E. Cartoon depicting orientation of the image planes shown in D relative to the CACO-2BBE monolayer and the volume sampled during confocal imaging. F. Pearson’s correlation coefficients calculated between green (MYO1A construct) and magenta (F-actin) channels on a per-cell basis; this value reflects the extent of colocalization between each expressed protein and the microvillar actin cytoskeleton. Each point represents a measurement from a single cell; N = 40, 87, 58 cells for WT, D240N, and I678F, respectively. Solid black lines denote median correlation coefficients. Statistical differences were determined by Kruskal-Wallis ANOVA test.
Figure 4.
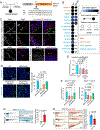
Figure 4.. Genetic and Functional Studies of MON1A Variants.
A. Trio WES identified biallelic variants in MON1A in a CODE proband. Pedigree is on the left, and a schematic illustration of the protein domain architecture is on the right, highlighting the amino acid change and its conservation across species: human (hu), mouse (mo), and zebrafish (zf). B. ProHits-viz Dot Plot diagram depicting BioID data for select proximity interactors of the MON1A WT and CODE variant proteins, as described in Figure 2e. C. (upper) Immunofluorescence images for healthy control and R249C MON1A proband tissue showing Ezrin (greyscale and green), RAB7 (greyscale and red), E-cadherin (magenta) and DAPI (blue). Arrows show reduced Ezrin at the apical brush border and loss of RAB7 positive vesicles in R249C MON1A tissue. (lower) Immunofluorescence images for healthy control and R249C MON1A proband tissue showing NHE3 (greyscale and red). Arrows show that NHE3 is localized on the apical brush border in control tissue and loss of brush border localization in R249C MON1A proband tissue. D. (Left) Representative images of wildtype HT-29-cells, MON1A, MON1A knockdown (MON1A-KD), or MON1A knockdown with expression of patient-variant R249C MON1A protein, or wild-type MON1A protein showing RAB7 (green) and cell nuclei (blue). (right) Summary graphs of RAB7+ vesicle size and count per cell. Statistical differences were determined by ordinary one-way ANOVA with multiple comparisons. Mean ± SEM, N = 3 experiments. E. Lysosome acidification in HT-29 cells using phRODO-EGF in MON1A wildtype or MON1A knockdown (MON1A-KD) +/− bafilomycin. Data is presented as percentage of MON1A. Statistical differences were determined by ordinary one-way ordinary one-way ANOVA with multiple comparisons. Mean ± SEM, N = 3 experiments. F. Polarized epithelial transcytosis of IgG in MDCK-FcRn cells. Summary of FcRn-dependent IgG concentrations crossing epithelium either from apical to basolateral (left) or basolateral to apical (right) in MON1A knockdown (MON1A-KD) MDCK-FcRn cells, and MON1A knockdown (MON1A-KD) MDCK-FcRn cells with expression of R249C MON1A or WT MON1A protein. Statistical differences were determined by ordinary one-way ANOVA with multiple comparisons. Mean ± SEM, N = 4 experiments. G. Representative bright-field images of wt and mon1a zebrafish at 9dpf. 12.5% mon1a−/−mutants showed high mucin secretion by alcian blue staining. Blue dots and areas indicate goblet cells and mucins in the gut. N = 56 for mon1a−/− at 9 dpf. N = 60 for wt at 9 dpf. The thickness of mucin was measured in the 12.5% mon1a−/− group, characterized by an increased mucin phenotype, and compared to wt. Statistical differences were determined by Student’s t-test. Mean ± SD, N = 7, Mean ± SD. H. 76.7% of mon1a−/− mutants displayed reduced lysosome activity in lysosome-rich enterocytes (LRE) at 6dpf. Red areas indicate the functional absorptive LREs. (N = 56 for mon1a−/− at 6dpf). The intensity of the red color for LRE cells was quantitated. Statistical differences were determined by Student’s t-test. N = 15, Mean ± SD.

References

    1. Thiagarajah JR, Kamin DS, Acra S, et al. Advances in Evaluation of Chronic Diarrhea in Infants. Gastroenterology 2018. DOI: 10.1053/j.gastro.2018.03.067. - DOI - PMC - PubMed
    1. Kaji I, Thiagarajah JR, Goldenring JR. Modeling the cell biology of monogenetic intestinal epithelial disorders. J Cell Biol 2024;223(7) (In eng). DOI: 10.1083/jcb.202310118. - DOI - PMC - PubMed
    1. Avitzur Y, Jimenez L, Martincevic I, et al. Diet management in congenital diarrheas and enteropathies - general concepts and disease-specific approach, a narrative review. Am J Clin Nutr 2024;120(1):17–33. (In eng). DOI: 10.1016/j.ajcnut.2024.05.004. - DOI - PMC - PubMed
    1. Muller T, Hess MW, Schiefermeier N, et al. MYO5B mutations cause microvillus inclusion disease and disrupt epithelial cell polarity. Nat Genet 2008;40(10):1163–5. DOI: 10.1038/ng.225. - DOI - PubMed
    1. Sivagnanam M, Mueller JL, Lee H, et al. Identification of EpCAM as the gene for congenital tufting enteropathy. Gastroenterology 2008;135(2):429–37. DOI: 10.1053/j.gastro.2008.05.036. - DOI - PMC - PubMed

Substances