. 2025 Apr 2;16(1):3162.
doi: 10.1038/s41467-025-58383-4.

Inhibition of tau neuronal internalization using anti-tau single domain antibodies

Affiliations

Inhibition of tau neuronal internalization using anti-tau single domain antibodies

Clément Danis et al. Nat Commun. .

Abstract

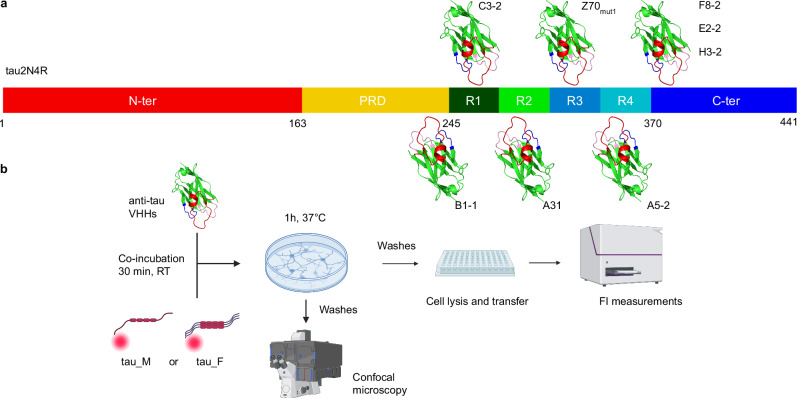
In Alzheimer's disease, tau pathology spreads across brain regions as the disease progresses. Intracellular tau can be released and taken up by nearby neurons. We evaluated single domain anti-tau antibodies, also called VHHs, as inhibitors of tau internalization. We identified three VHH inhibitors of tau uptake: A31, H3-2, and Z70mut1. These VHHs compete with the membrane protein LRP1, a major receptor mediating neuronal uptake of tau. A31 and Z70mut1 bind to microtubule binding domain repeats, which are involved in the interaction with LRP1. VHH H3-2 is the only VHH from our library that reduces the internalization of both monomeric tau and tau fibrils. VHH H3-2 binds a C-terminal tau epitope with high affinity. Its three-dimensional structure in complex with a tau peptide reveals a unique binding mode as a VHH-swapped dimer. These anti-tau VHHs are interesting tools to study tau prion-like propagation in tauopathies and potentially develop novel biotherapies.


Conflict of interest statement

Competing interests: J.-C.R. is the CEO of Hybrigenic Services. C.D., E.D., J.-C. R., L.B., and I.L. are the inventors of a patent (WO2020/120644A1) that covers the use of VHH Z70 and VHHs derived from it. The remaining authors declare no competing interests.

Figures

Fig. 1
Fig. 1. Overview of the tau epitopes recognized by the anti-tau VHHs used in this study and schematic representation of the tau neuronal uptake assays.
a Schematic representation of the tau epitopes recognized by each anti-tau VHH. VHH B1-1 binds to the tau proline-rich domain (PRD). VHH C3-2 binds to the amino-acid sequence located between the PRD and the R1 repeat of the tau microtubule-binding domain (MTBD). VHH A31 binds to the PHF6* region within the R2 repeat (Supplementary Fig. 1). VHH Z70mut1 binds to the PHF6 region within the R3 repeat. VHH A5-2 binds to the R4 repeat. VHH F8-2, E2-2, and H3-2 bind to the C-terminal domain (C-ter) of tau (Supplementary Fig. 2). The epitopes were determined by 2D NMR interaction mapping experiments, as previously described. b Schematic representation of the tau cellular uptake assay. Recombinant monomeric (tau_M) or fibrils of tau1N4R (tau_F) labeled with fluorescent dyes (Alexa546 and Atto565, respectively) and VHHs were co-incubated for 30 min at room temperature (RT). Tau-VHHs complexes were then incubated with primary neurons for 1 h at 37 °C. Finally, cells were washed and analyzed by confocal microscopy or lysed and transferred to a 96-well plate for fluorescence imaging. Created in BioRender. Tautou, M. (2025) https://BioRender.com/a27l880.
Fig. 2
Fig. 2. Cellular internalization of monomeric tau is inhibited by anti-tau VHHs A31 and H3-2.
a Inhibition of cellular uptake of monomeric tau1N4R by the anti-tau VHHs. Percentage of cellular tau uptake based on Alexa546 fluorescence signal coming from monomeric tau1N4R (50 nM) co-incubated with PBS (tau_M), RAP (100 nM), heparin (50 µg/mL), and the VHHs (100 nM). n = 4 independent experiments per condition. Data were normalized to the condition of tau1N4R pre-incubated with PBS as 100% of tau uptake. Box plots show the median (center line), 25th, 75th percentiles (box), and minimum and maximum values (whiskers), all data points are shown (single points). Data were analyzed using one-way nonparametric ANOVA (Kruskal-Wallis) with Dunn’s multiple comparison test ****p  <  0.0001; ***p  <  0.001). RAP, VHHs A31 (p = 0.0004), and H3-2 significantly reduced cellular tau uptake. b Confocal microscopy analysis of cellular tau uptake assay using recombinant tau1N4R labeled with Alexa546 dye and in the presence of PBS (tau_M), RAP, heparin, and VHHs A31, Z70mut1 or H3-2 (images are representative of a n = 2 independent experiments per condition). Tau was visualized in red, and nuclei in light blue. The scale bar is 10 µm.
Fig. 3
Fig. 3. VHHs A31 and Z70mut1 block the cellular uptake of recombinant tau microtubule binding domain (tauMTBD).
Cellular tauMTBD uptake assay performed using 0.5 µM of recombinant monomeric tauMTBD labeled with the Atto488 fluorophore. a Percentage of cellular tauMTBD uptake based on Atto488 fluorescence signal quantification in the conditions resulting from tauMTBD co-incubation with each of the VHHs anti-GFP, A31, Z70mut1, E2-2, and H3-2 at a concentration of 1 µM. n = 3 independent experiments per condition. Data were normalized to the percentage of uptake relative to the condition of tauMTBD pre-incubated with PBS, defined as 100% of tauMTBD uptake. Box plots show the median (center line), 25th, 75th percentiles (box), and minimum and maximum values (whiskers), all data points are shown (single points). Data were analyzed using one-way nonparametric ANOVA (Kruskal-Wallis) with Dunn’s multiple comparison test (****p  <  0.0001; **p  <  0.01). VHHs A31 and Z70mut1 (p = 0.0061) significantly reduced cellular tau uptake. b Confocal microscopy analysis of cellular tauMTBD uptake assay under the conditions described in (a) (images are representative of a n = 2 independent experiments per condition). TauMTBD is visualized in green, and nuclei in light blue. The scale bar is 10 µm.
Fig. 4
Fig. 4. Cellular internalization of tau fibrils is inhibited by the anti-tau VHH H3-2.
a Inhibition of cellular uptake of fibrillar tau1N4R by the anti-tau VHHs. Percentage of cellular tau fibril uptake based on Atto565 fluorescence signal coming from tau1N4R fibrils co-incubated with PBS (tau_F), RAP (400 nM), heparin (50 µg/mL), and the VHHs (400 nM). n = 3 independent experiments per condition. Data were normalized to the condition of tau1N4R fibrils pre-incubated with PBS as 100% of tau uptake. Box plots show median (center line), 25th, 75th percentiles (box,) and minimum and maximum values (whiskers), all data points are shown (single points). Data were analyzed using one-way nonparametric ANOVA (Kruskal-Wallis) with Dunn’s multiple comparison test (****p  <  0.0001; **p  <  0.01). Heparin and VHH H3-2 (p = 0.0096) significantly reduced cellular tau fibril uptake. b Confocal microscopy analysis of fibrillar tau cellular assays using recombinant tau1N4R fibrils labeled with Atto565 dye and in the presence of PBS (tau_M), RAP, heparin, and VHHs A31, Z70mut1, or H3-2 (images are representative of a n = 2 independent experiments per condition). Tau was visualized in red, and nuclei in light blue. The scale bar is 10 µm.
Fig. 5
Fig. 5. VHHs A31, Z70mut1 and H3-2 compete for the interaction between monomeric tau1N4R and LRP1 cluster III in vitro.
Sensorgram (control subtracted data) of tau1N4R binding to immobilized LRP1 cluster III in the absence (black curve) or the presence of 30 (yellow curve), 100 (orange curve), and 300 nM (red curve) of (a) VHH E2-2, of (b) VHH A31, of (c) VHH Z70mut1 and of (d) VHH H3-2.
Fig. 6
Fig. 6. VHH H3-2 binds with high affinity to its tau C-terminal epitope and dimerizes in vitro.
a Sensorgrams (reference subtracted data) of multi-cycle kinetics (MCK) analysis performed on immobilized biotinylated VHH E2-2 and H3-2, with injections of increasing concentrations of tau[369–381] C-terminal peptide (from 3 nM to 100 µM and from 3 nM to 32 µM, respectively; n = 3 independent experiments). Black lines correspond to the fitted curves, red lines correspond to the measurements. KDs were obtained using the kinetic model and are presented as mean values ± standard deviation (b). The maximum response (RU) observed for each peptide concentration was plotted and represented as a concentration-response curve (CRC). Black lines correspond to the fitted curves, red dots to the mean of the maximum response (in RU), from experiment (a) for each peptide concentration. Error bars represent standard deviation. The KD and stoichiometric ratio (SR) values extracted from these data are shown. KDs were obtained using the steady-state fitting model and are presented as mean values ± standard deviation. The SR have been calculated from the Rmax of the biological replicate represented here. c Ribbon representation of the crystal structure of the complex between VHH H3-2 and the tau[369–381] C-terminal peptide. The CDR1, CDR2, and CDR3 loops of VHH H3-2 are colored in pink, in dark blue, and in red, respectively. The framework regions of the VHHs are shown in green for one subunit and yellow for the other. The tau[369–381] peptides are shown in cyan and light blue.
Fig. 7
Fig. 7. VHH H3-2 spontaneously dimerizes in solution and its dimerization is stabilized by binding to tau[369–381] C-terminal peptide.
a Size exclusion chromatography (SEC) analysis (A280 nm) performed on either VHH E2-2 (blue curve) and VHH H3-2 (red curve) alone, or in the presence of a 2-fold excess of the tau[369–381] C-terminal peptide (ratio 1: 2, green and yellow curves, respectively). Elution peaks corresponding to VHH monomer and dimer species are highlighted on the chromatogram (chromatogram is representative of a n = 2 independent experiments). Estimation of the VHH molecular weights was performed using a calibration curve obtained from SEC analysis of proteins of known size (Supplementary Fig. 15). b Schematic representation of the homogeneous time-resolved fluorescence (HTRF) assay performed with VHHs H3-2 and E2-2. Terbium (Tb) and D2 fluorophores correspond to the donor and acceptor, respectively. c Plotted HTRF ratio data corresponding to the concentration-response curve of the tau[369–381] C-terminal peptide in the presence of 6Histag-H3-2: donor and 6Histag-H3-2: acceptor (red dots, n = 3 independent experiments) or 6Histag-E2-2: donor and 6Histag-E2-2: acceptor (blue dots, n = 2 independent experiments). Data are presented as mean ± standard error of the mean for VHH H3-2 or mean only for VHH E2-2. An increase in the HTRF signal ratio is observed when the peptide concentration is increased in the presence of VHH H3-2 paired fluorophores. EC50 mean value was obtained using the non-linear fit ([ligand] vs. response, 3 parameters) model.

Similar articles

Cited by

References

    1. Glynn, C., Rodriguez, J. A. & Hyman, B. T. The structural line between prion and ‘prion-like’: Insights from prion protein and tau. Curr. Opin. Neurobiol.86, 102857 (2024). - PMC - PubMed
    1. Zampar, S., Di Gregorio, S. E., Grimmer, G., Watts, J. C. & Ingelsson, M. ‘Prion-like’ seeding and propagation of oligomeric protein assemblies in neurodegenerative disorders. Front. Neurosci.18, 1436262 (2024). - PMC - PubMed
    1. Vazquez-Sanchez, S. et al. Frontotemporal dementia-like disease progression elicited by seeded aggregation and spread of FUS. Mol. Neurodegener.19, 46 (2024). - PMC - PubMed
    1. Pongrácová, E., Buratti, E. & Romano, M. Prion-like Spreading of Disease in TDP-43 Proteinopathies. Brain Sci.14, 1132 (2024). - PMC - PubMed
    1. Neupane, K. et al. Direct observation of prion-like propagation of protein misfolding templated by pathogenic mutants. Nat. Chem. Biol.20, 1220–1226 (2024). - PubMed

MeSH terms

LinkOut - more resources