

Impact of prenatal phthalate exposure on newborn metabolome and infant neurodevelopment
- PMID: 40175358
- PMCID: PMC11965525
- DOI: 10.1038/s41467-025-57273-z
Impact of prenatal phthalate exposure on newborn metabolome and infant neurodevelopment
Abstract
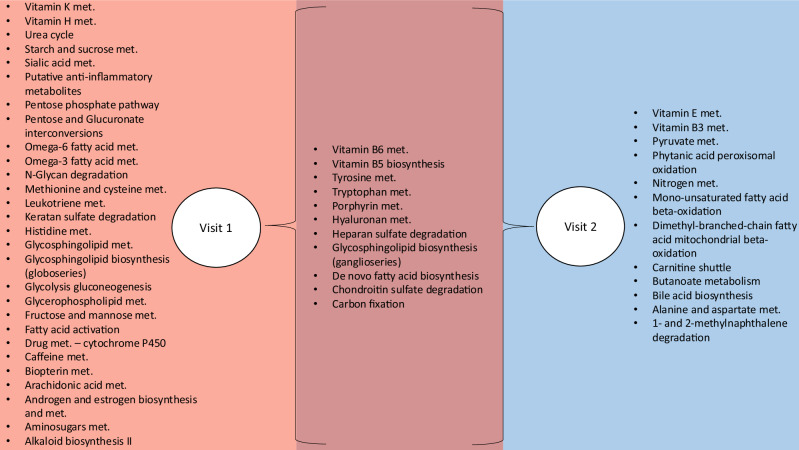
We evaluated associations among exposure to prenatal phthalate metabolites, perturbations of the newborn metabolome, and infant neurobehavioral functioning in mother-newborn pairs enrolled in the Atlanta African American Maternal-Child Cohort during 2016-2018. We quantified eight phthalate metabolites in prenatal urine samples collected between 8- and 14-weeks' (visit 1; n = 216) and 24- and 30-weeks' gestation (visit 2; n = 145) and metabolite features in newborn dried-blood spot samples collected at delivery. Associations between phthalate metabolite concentrations and metabolic feature intensities at both visits were examined using adjusted generalized linear models (MWAS). Then, an exploratory meet-in-the-middle (MITM) analysis was conducted in a subset with NICU Neonatal Neurobehavioral Scale (NNNS) scores (visit 1 n = 81; visit 2 n = 71). In both the MWAS and MITM, many of the confirmed metabolites are involved in tyrosine and tryptophan metabolism, including tryptophan, tyrosine, thyroxine, and serine. This analysis elucidates how prenatal phthalate exposure disrupts the newborn metabolome and infant neurobehavioral outcomes.
© 2025. The Author(s).
Conflict of interest statement
Competing interests: The authors declare no competing interests.
Figures


References
-
- Phthalates factsheet | National Biomonitoring Program | CDC. https://www.cdc.gov/biomonitoring/Phthalates_FactSheet.html (2021).
-
- Varshavsky, J. R., Zota, A. R. & Woodruff, T. J. A novel method for calculating potency-weighted cumulative phthalates exposure with implications for identifying racial/ethnic disparities among U.S. reproductive-aged women in NHANES 2001–2012. Environ. Sci. Technol.50, 10616–10624 (2016). - PMC - PubMed
MeSH terms
Substances
Grants and funding
- R01 NR014800/NR/NINR NIH HHS/United States
- R01 MD009064/MD/NIMHD NIH HHS/United States
- R01 MD009746/MD/NIMHD NIH HHS/United States
- R21 ES032117/ES/NIEHS NIH HHS/United States
- R01MD009064/U.S. Department of Health & Human Services | National Institutes of Health (NIH)
- U2C ES026560/ES/NIEHS NIH HHS/United States
- P30 ES019776/ES/NIEHS NIH HHS/United States
- R24 ES029490/ES/NIEHS NIH HHS/United States
- U24 ES029490/ES/NIEHS NIH HHS/United States
- U2CES026560/U.S. Department of Health & Human Services | NIH | Center for Scientific Review (NIH Center for Scientific Review)
- P50ES02607/U.S. Department of Health & Human Services | NIH | Center for Scientific Review (NIH Center for Scientific Review)
- T32 ES012870/ES/NIEHS NIH HHS/United States
- UH3 OD023318/OD/NIH HHS/United States
- P30ES019776/U.S. Department of Health & Human Services | NIH | Center for Scientific Review (NIH Center for Scientific Review)
- R24ES029490/U.S. Department of Health & Human Services | National Institutes of Health (NIH)
- R01 ES035738/ES/NIEHS NIH HHS/United States
- 83615301/U.S. Environmental Protection Agency (US Environmental Protection Agency)
- UG3 OD023318/OD/NIH HHS/United States
- UH3OD023318/U.S. Department of Health & Human Services | NIH | Center for Scientific Review (NIH Center for Scientific Review)
LinkOut - more resources
Full Text Sources
Medical
