. 2025 Apr 2;16(1):3157.
doi: 10.1038/s41467-025-58391-4.

A deep learning framework for instrument-to-instrument translation of solar observation data

Affiliations

A deep learning framework for instrument-to-instrument translation of solar observation data

R Jarolim et al. Nat Commun. .

Abstract

The constant improvement of astronomical instrumentation provides the foundation for scientific discoveries. In general, these improvements have only implications forward in time, while previous observations do not benefit from this trend, and the joint use of data sets from different instruments is typically limited by differences in calibration and quality. We provide a deep learning framework for Instrument-To-Instrument translation of solar observation data, enabling homogenized data series of multi-instrument data sets. This is achieved by unpaired domain translations with Generative Adversarial Networks, which eliminate the need for spatial or temporal overlap to relate instruments. We demonstrate that the available data sets can directly profit from instrumental improvements, by applying our method to four different applications of ground- and space-based solar observations. We obtain a homogenized data series of 24 years of space-based observations of the solar EUV corona and line-of-sight magnetic field, solar full-disk observations with increased spatial resolution, real-time mitigation of atmospheric degradations in ground-based observations, and unsigned magnetic field estimates from the solar far-side based on EUV imagery. The direct comparison to simultaneous high-quality observations shows that our method produces images that are perceptually similar, and enables more homogeneous multi-instrument data sets without the requirement of spatial or temporal alignment.


Conflict of interest statement

Competing interests: The authors declare no competing interests.

Figures

Fig. 1
Fig. 1. Overview of the model training cycle for the synthesis of low-quality images.
Images are transformed from the high-quality domain (B) to the low-quality domain (A) by generator G BA (yellow). The synthetic images are translated by generator G AB (blue) back to domain B. The mapping into domain A is enforced by discriminator D A, which is trained to distinguish between real images of domain A (bottom) and generated images (top). Both generators are trained jointly to fulfill the cycle consistency between original and reconstructed image, as well as for the generation of synthetic images that correspond to domain A. The generation of multiple low-quality versions from a single high-quality image is accomplished with the additional noise term that is added to generator BA.
Fig. 2
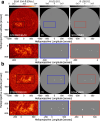
Fig. 2. Evaluation of the ITI translation for the homogenization of SOHO with SDO observations and calibration of EUV data series.
a Two examples of SOHO-to-SDO translation from 2010-05-13 07:00 (left) and 2010-08-05 01:00 (right). The boxes indicate the cutouts in panel b where we compare ITI images with aligned SDO/AIA filtergrams. We compare 300 × 300 and 100 × 100 cutouts of EUV filtergrams and LOS magnetograms, respectively. We directly compare observations taken at the same time from SOHO (left), ITI (center) and SDO (right). 131 Å: The observed feature is difficult to identify in the SOHO observation, while the ITI enhanced version resolves a clear filament structure that is consistent with the SDO observation. 195/193 Å: details in the quiet-Sun region are blurred in the SOHO image. The obtained features by ITI are consistent on a global scale with SDO, but more deviations occur at the smallest resolution scales. 284/211 Å: ITI recovers faint off-limb loops that are not resolved by SOHO. The pixel-noise at the bottom left is mitigated, but results in spurious features. 304 Å: The active region shows a valid reconstruction from the strongly pixelated observation. LOS Magnetogram: Small magnetic elements are better resolved and appear deconvolved in the ITI image. The shape of the sunspot is well reconstructed, however the full quality of the SDO/HMI magnetograms can not be reached by ITI. c Comparison of the SDO reference and calibrated SOHO/EIT and STEREO/EUVI EUV light-curves. The mean intensities for each channel are plotted against time in the individual panels. The data is smoothed by a running average filter, where the blue shaded area corresponds to 1 standard deviation of the SDO intensities. The solar cycle trend can be seen for each light-curve. ITI adjusts the individual observations to a similar scale (DN/s), which outperforms the baseline approach.
Fig. 3
Fig. 3. Comparison of simultaneously observed SOHO/MDI, ITI enhanced, and SDO/HMI LOS magnetograms (B LOS).
a Visual comparison of the global calibration differences, showing observations from 2010-05-13 19:12 (top) and 2010-08-16 12:48 (bottom). The MDI magnetograms show global inhomogeneities, that prevent a simple calibration of the series. ITI largely mitigates these variations, leading to more consistent observations, that are in agreement with the HMI reference. b Unsigned magnetic flux density of the three magnetogram series for the period of parallel MDI and HMI observations starting from 2010-09-13. The MDI series shows substantial fluctuations, that are mitigated by ITI. The absolute error (MAE) and cross-correlation (CC) evaluations indicate a strong improvement in similarity between the ITI adjusted series and the HMI reference.
Fig. 4
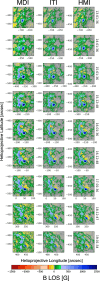
Fig. 4. Direct comparison of the active region NOAA 11106 over seven consecutive days.
The LOS magnetograms cover 150 × 150. ITI images show a similar appearance and sharpness to the SDO/HMI observations, while being also consistent with the low-resolution SOHO/MDI observations. The blue shaded area in Fig. 3b indicates the time frame of the images shown.
Fig. 5
Fig. 5. Evaluation of ITI translations of SDO/HMI continuum observations using simultaneous observations of SDO/HMI and Hinode/BFI continuum from 2013-11-18 17:46:20 and 2013-11-18 17:46:28, respectively.
a Original HMI (top left) and ITI enhanced (bottom right) full-disk observation. b Comparison of a 222 × 222 region and corresponding Hinode/BFI observation with full field-of-view and resolution. c Matched features of the original HMI, ITI enhanced and Hinode/BFI observation with 13 × 13 spatial extent. The penumbral features of ITI match the real observation. The small scale separation of the individual fibrils is beyond the resolution limit of HMI, but are largely reconstructed in the ITI observation. The coarse shape of the granulation pattern and the solar pore match the Hinode/BFI observation, while smaller intergranular lanes show deviations. d Example of the comparison between ITI and the deconvolution approach (2014-12-19 22:33). We show the original HMI image, the enhanced images and the absolute error maps to the original Hinode/BFI image. The ITI image shows a better agreement with the high-resolution reference, as can be seen from the reduced errors in the penumbra and sharper boundaries of the pores. An animation of the temporal evaluation from 2014-11-22 is provided in Supplementary Movies 1 and 2.
Fig. 6
Fig. 6. Evaluation of ITI translations for the mitigation of atmospheric degradations.
a Comparison of the ITI mitigation of atmospheric effects during varying observing conditions. From top to bottom we show low-quality KSO observations, the ITI reconstructed observations and reference high-quality observations that were taken minutes after the low-quality observation. We show two samples (800 × 800), where clouds are present in the low-quality KSO observation. The ITI reconstruction leads to clearer and unobstructed observations, where small chromospheric features remain unchanged and appear sharper. b Estimated image quality distribution of the original low-quality KSO observations (blue) and the ITI enhanced observations (orange). The red dashed line indicates the 0.25 quality threshold. c Three full-disk images with the lowest image quality after the ITI enhancement (about 0.24).
Fig. 7
Fig. 7. Comparison between the synthetic ITI and overlapping SOHO/EIT magnetograms.
In panels a and b we show observations from 2006-12-27 13:20 and 2007-01-07 19:20, respectively. STEREO/EUVI observations of the 304 Å channel are given for comparison and scaled by their maximum and minimum value. The magnetograms show the absolute values of the LOS magnetic field strength and are scaled linearly to 2000 Gauss. The flux distribution at the full-disk scale is in agreement between the ITI and SOHO/MDI observations. The comparison of the active region in a shows that the ITI magnetogram matches the overall flux distribution. The active region in b shows larger deviations that mainly originate from confined regions (i.e., sunspots) where ITI overestimates the magnetic field strength. An animated version is provided in the Supplementary Materials (Supplementary Movie 3).
Fig. 8
Fig. 8. Qualitative evaluation of synchronic heligraphic maps obtained from SDO/AIA+HMI and ITI enhanced STEREO/EUVI data.
We show three consecutive observations of heliographic synchronic magnetograms displaying the absolute value of the LOS magnetic field strength (left) and reference EUV maps in three different filters (304, 193, 211 Å; right). We compare ITI magnetograms obtained from STEREO EUV filtergrams with real observations from SDO/HMI. All magnetograms are scaled to 1000 Gauss. We show the same active regions (blue circle) as observed by each instrument over 16 days. In the top row and bottom row the active regions are observed by STEREO B and STEREO A, respectively. The comparison to the real SDO/HMI observation (middle row) shows that ITI detects a similar magnetic flux distribution. Both ITI magnetograms show sunspot configurations with the characteristic tilt of preceding and following sunspot (Joy’s law), but deviate from the SDO/HMI observation in terms of stronger and more confined magnetic fields (i.e., more sunspots). The green circle indicates the magnetic field configuration of the filament, that can be seen in the EUV observations. The ITI magnetograms show a similar magnetic flux distribution to the SDO/HMI observation. An animated version of this figure is provided online (Supplementary Movie 4). ITI performs a domain translation that also includes the EUV channels. As can be seen from the heliographic EUV maps, the translated EUV channels smoothly integrate with the SDO observations.

Similar articles

References

    1. Jungbluth, A. et al. Single-frame super-resolution of solar magnetograms: investigating physics-based metrics \& losses. Preprint at arXiv10.48550/arXiv.1911.01490 (2019).
    1. Hamada, A., Asikainen, T. & Mursula, K. New homogeneous dataset of solar EUV synoptic maps from SOHO/EIT and SDO/AIA. Sol. Phys.295, 1–20 (2020).
    1. Hamada, A., Asikainen, T. & Mursula, K. A uniform series of low-latitude coronal holes in 1973-2018. Sol. Phys.296, 40 (2021).
    1. Goodfellow, I., Bengio, Y. & Courville, A. Deep Learning (MIT Press, 2016).
    1. Ramos, A. A., de la Cruz Rodríguez, J. & Yabar, A. P. Real-time, multiframe, blind deconvolution of solar images. Astron. Astrophys.620, A73 (2018).

LinkOut - more resources