. 2025 Apr 2;16(1):3167.
doi: 10.1038/s41467-025-58266-8.

Effective extracellular payload release and immunomodulatory interactions govern the therapeutic effect of trastuzumab deruxtecan (T-DXd)

Affiliations

Effective extracellular payload release and immunomodulatory interactions govern the therapeutic effect of trastuzumab deruxtecan (T-DXd)

Li-Chung Tsao et al. Nat Commun. .

Abstract

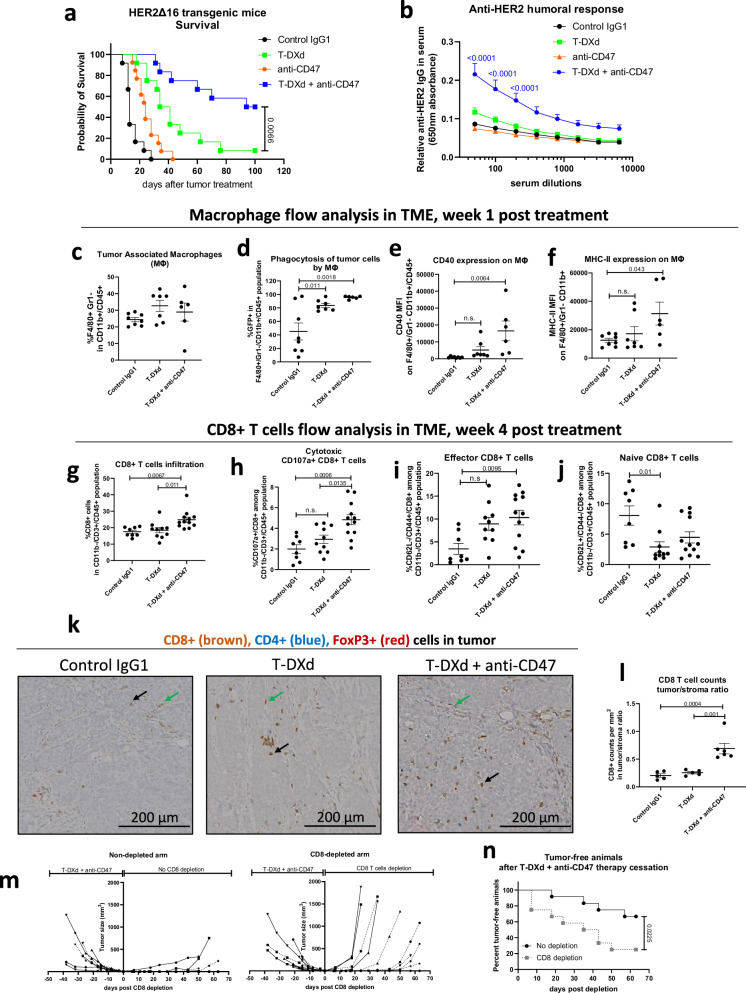
Trastuzumab deruxtecan (T-DXd) is an antibody-drug conjugate (ADC) targeting HER2, exhibiting significant clinical efficacy in breast cancer (BC) with varying HER2 expression, including HER2-low and HER2-ultralow. However, the precise mechanism underlying its efficacy and the contribution of immune activation in these settings remain unclear. Here, we demonstrate that T-DXd efficacy in HER2-low and HER2-negative BC is independent of HER2 engagement and ADC internalization. Instead, its activity relies on extracellular proteases, such as cathepsin L (CTSL), within the tumor microenvironment. Irrespective of their HER2 status, tumor and stromal compartments of invasive BC abundantly express CTSL, which efficiently cleaves the specialized linker of T-DXd, facilitating payload release and inducing cytotoxicity against HER2-low/negative tumors. In HER2-positive BC, the antibody backbone of T-DXd engages Fcγ-receptors and drives antibody-dependent cellular phagocytosis (ADCP). Concurrently, its cytotoxic payload (DXd) induces immunogenic cell death, further activating myeloid cells via TLR4 and STING pathways to enhance tumor antigen presentation to CD8+ T cells. Notably, T-DXd cytotoxicity also upregulates tumor CD47 expression, dampening immune activation. Combining T-DXd with CD47 checkpoint blockade significantly enhances anti-tumor immune responses in a HER2-transgenic BC mouse model, while also inducing durable CD8+ T cell memory to prevent tumor recurrence after therapy cessation.


Conflict of interest statement

Competing interests: The authors declare no competing interests.

Figures

Fig. 1
Fig. 1. T-DXd cytotoxicity against HER2-Low and HER2-Negative tumors in vivo occurs independently of HER2-High cells in proximity.
a T-DXd internalization in cancer lines with different HER2 expression levels. T-DXd or control antibody (rituximab) were labeled with pHrodo to assess internalization into the endosome. Endocytosis was analyzed at 24 h post treatment. Representative flow histograms are shown for each T-DXd concentration. b Summary of T-DXd internalization. c Cell lines with different HER2 expression were treated with indicated ADCs or antibodies for 4 days, and cell viability was assessed by cellular ATP quantification. d In vitro bystander killing analysis. Vybrant DiD-labeled Au565 cells and Cell-Trace Violet-labeled MDA-MB-468 cells were co-cultured (1:2 ratio) with antibodies/ADCs (100 ng/mL) for 2 and 6 days. Apoptosis was assessed by AnnexinV/PI staining. e, f Summary of direct Au565 killing and bystander MDA-MB-468 killing. Total AnnexinV+ percentages (early and late apoptosis combined) are plotted. g, h Similar co-culture experiment using labeled HER2-low CAPAN-1 and MDA-MB-468, treated with 1 µg/mL of antibodies/ADCs. Apoptosis was assessed by AnnexinV/PI staining. b, c, eh Two-way ANOVA with Tukey’s multiple comparisons test (n = 3). ik HER2-ADC therapeutic efficacies on various BC xenografts with different HER2 expression engrafted in mammary fat pads of SCID mice. Tumor-bearing animals were treated weekly (arrows indicated) with T-DXd or T-DM1 (10 mg/kg each) or vehicle control PBS. l Diagram of KPL4 and MDA-MB-468 dual-implantation into the right and left mammary fat pads of SCID mice. Created in BioRender. Hartman, Z. (2025) https://BioRender.com/f86p031. m, n Tumor-bearing mice in (l) were treated weekly with rituximab, T-DXd, or T-DM1 (10 mg/kg, arrows indicated). Tumor growths from each side are plotted. in Mixed-effects analysis (REML) with Tukey’s multiple comparisons. i, k, m, n n = 5, (j) (n = 10). All data is presented as mean ± SEM with p values. n.s. = not significant.
Fig. 2
Fig. 2. HER2-independent DXd payload release by Cathepsin L (CTSL) and its expression in human breast cancer biopsies.
a MDA-MB-231 tumors treated with T-DXd (4 mg/kg) were co-injected with fivefold higher dose of trastuzumab (20 mg/kg) to assess T-DXd efficacy after HER2 binding competition. Mixed-effects analysis (REML) with Tukey’s multiple comparisons (n = 10). Arrows indicate treatment administered. b Liquid chromatography-mass spectrometry (LC-MS) quantification of DXd molecules in tumors treated with T-DXd (10 mg/kg) for 3 days. DXd levels per tumor mass were quantified. One-way ANOVA with Tukey’s multiple comparisons test (n = 13). c Systemic DXd payload levels in plasma from same treated animals in (b). DXd levels (ng) per plasma volume (mL) were quantified. No statistical significance between plasma groups was observed (n = 13). d T-DXd was incubated with recombinant human CTSL or CTSB for 6 h in low pH assay buffer as described in Methods. Released DXd levels were quantified by LC-MS. e Cytotoxicity of cleaved T-DXd was assessed on MDA-MB-468 cells. f Immunohistochemistry analysis of primary core needle biopsies from BC patients. Representative HER2 expression (top row) is shown. CTSL expression and localization in the same patient’s biopsy are shown (bottom row). Positive staining in tumor beds (red arrows) and stromal compartments (black arrows) are indicated. gi Tissue microarray comprising 321 invasive BC, 20 DCIS, and 49 normal breast samples were assessed for CTSL expression via IHC. Pixelwise H-scores were used for quantification by QuPath. One-way ANOVA with Tukey’s multiple comparisons test. g CTSL expression differences in invasive BC, DCIS, and normal breast. h CTSL expression among lymph node-negative, lymph node-positive, or metastatic BC. i CTSL expression among BC with different HER2 IHC scores.
Fig. 3
Fig. 3. Tumor Cathepsin L mediates extracellular payload release of T-DXd in tumor microenvironment, contributing to therapeutic efficacy in HER2-low BC.
a, b Au565 cells were assessed for T-DXd (a) or T-DM1 (b) cytotoxicity in vitro in the presence of CTSL inhibitor (3 µM Z-Phe-Phe-FMK). c Au565 cells overexpressing CTSL or lacking CTSL were assessed for T-DXd cytotoxicity in vitro. d Extracellular CTSL secretion by MDA-MB-231 lines was quantified with ELISA analysis of conditioned media. e Secreted proteins in conditioned media of indicated cell lines were concentrated and quantified for CTSL enzymatic activity in assay buffer. ae Two-way ANOVA with Tukey’s multiple comparisons test (n = 3 per group). Nonlinear regression curve fit to calculate IC50 values. f Parental and CTSL-overexpressed MDA-MB-231 cells were implanted in SCID mice, and treated with T-DXd (5 mg/kg) or control PBS. g Control-KO and CTSL-KO MDA-MB-231 cells were implanted in SCID mice, and treated with T-DXd (10 mg/kg) or control PBS. fh Mixed-effects analysis (REML) with Tukey’s multiple comparisons (n = 10). Arrows indicate time of treatments administered. h Tumor sizes (mm3) measured at end point for studies using MDA-MB-231 CTSL-KO lines. i Immunohistochemistry verifications of CTSL expression in parental or CTSL-modified MDA-MB-231 tumors. j LC-MS quantification of DXd in MDA-MB-231 parental (n = 15) versus CTSL-overexpressed tumors (n = 10), treated with T-DXd (10 mg/kg) for 5 days. k LC-MS quantification of DXd in MDA-MB-231 control-KO versus three different CTSL-KO pools, treated with T-DXd (10 mg/kg) for 3 days (n = 10 for all groups, except n = 6 for CTSL-KO #2). h, k One-way ANOVA with Tukey’s multiple comparisons. j Two-sided Mann–Whitney test. All data is presented as mean ± SEM with p values indicated.
Fig. 4
Fig. 4. T-DXd cytotoxicity induces immunogenic tumor cell death, activating nearby myeloid immune cells for antigen presentation.
a, b Au565 cells were treated with DXd, DM1, or HER2-ADCs for 3 days, and extracellular ATP was measured. c, d Au565 and KPL4 cells were treated for 3 days, and extracellular HMGB1 release was quantified by Lumit-Immunoassays normalized to cell viability. e Surface Calreticulin (CRT) on dying tumor cells was measured by flow cytometry on Au565 cells after treatment for 2 days. ae Two-way ANOVA with Tukey’s multiple comparisons (n = 3). fj Flow cytometry assessment of human macrophage surface expression of (f) HLA-A2, (g) HLA-DR, (h) CD80, (i) CD40, and (j) CCR7 after 2-days co-culturing with Au565 cells pre-treated with indicated antibodies or ADCs. Macrophage experiments derived from two representative PBMC donors are shown. MFI Mean Fluorescence Intensity. One-way ANOVA with Tukey’s multiple comparisons test (n = 3 per donor). k, l RNA-seq analysis of gene expression by human macrophages after one day co-culture with Au565 cells pre-treated with indicated antibodies/ADCs. Relative gene expression involved in (k) antigen presentation and (l) chemotaxis were assessed. Heat maps represent average gene counts (n = 3 per group) normalized with z-scores. All data is presented as mean ± SEM with p values.
Fig. 5
Fig. 5. T-DXd activates FCGRs and antibody-dependent cellular phagocytosis (ADCP) against HER2-high tumor cells, promoting tumor antigen presentation and CD8 T-cell activation.
a, b KPL4 cells treated with indicated antibodies/ADCs and co-cultured for 4 h with Jurkat effector cells expressing (a) human FCGR3A or (b) mouse FCGR4. FCGR signaling to lead to activation of NFAT-luciferase promoter-reporter in effector cells was assessed. c Representative flow graph demonstrating phagocytosis of Au565 cells by human monocyte-derived-macrophages upon treatment with indicated antibodies/ADCs (1 µg/mL) for 4 h. d, e Quantification of ADCP is mediated by (d) human macrophages or (e) mouse Bone-marrow-derived-macrophages (BMDMs). The percentage of macrophages containing tumor-label dye was plotted. fi Tumor antigen (eGFP) presentation to Just-EGFP-Death-Inducing (JEDI) CD8+ T cells by mouse BMDM. Au565 expressing eGFP were treated overnight with indicated antibodies, ADCs, or unconjugated payloads, then co-cultured with BMDMs for two days. CD8 + JEDI T cells were added to BMDM for 3 days to allow antigen presentation, T cell activation, and proliferation. f Representative flow graphs visualizing proliferating T cells, defined as Cell-TraceLow populations. g Summary of T cell proliferation. h Representative flow graphs of JEDI T cell activation assessment by surface CD44 expression. i Summary of CD44 expression on JEDI T cells. a, b Two-way ANOVA with Tukey’s multiple comparisons test. (n = 3). d, e, g, i One-way ANOVA with Dunnett’s multiple comparisons test (n = 3). All data plotted in this figure are presented as mean ± SEM with p values.
Fig. 6
Fig. 6. T-DXd mediated immune activation depends on STING/IFN-I and TLR4 signaling pathways.
a, b RNA-seq analysis of human macrophages co-cultured with treated Au565 cells. Relative gene expression in TLR4 signaling pathway and interferon-stimulated genes were analyzed. Heat maps show average gene counts (n = 3 per group) normalized with z-scores. cg BMDM generated from wild-type, TLR4-mutant or STING-KO mice and co-cultured for 2 days with Au565 cells with indicated treatments. BMDM surface expression of c MHC-II, d CD40, e CD80, and f CD86 were assessed. g IL-6 secretion by BMDM assessed with ELISA. h, i Au565 cells treated with indicated agents were co-cultured with plasmacytoid dendritic cells (pDC) derived from WT or STING-KO mice. IFNα1 secretion by pDCs was assessed by ELISA. ci Two-way ANOVA with Tukey’s multiple comparisons test was performed between indicated treatment groups or BMDM genotypes (n = 3). jl Tumor antigen (eGFP) presentation to JEDI CD8+ T cells by wild type (WT), TLR4-mutant or STING-KO BMDM after co-culture with T-DXd treated Au565-eGFP cells. j Representative JEDI T cells proliferation plot shown for each BMDM co-cultured. k Summary of JEDI T cells proliferation (defined as Cell-TraceLow) and l activation (CD44+) after co-culture with WT, TLR4-mutant and STING-KO BMDMs. Two-way ANOVA with Šidák’s multiple comparisons test. (n = 3). All data is presented as mean ± SEM with p values. n.s. not significant.
Fig. 7
Fig. 7. T-DXd mediated immune activation is restricted by tumor CD47 expression.
a Flow cytometry assessment of surface CD47 expression on Au565 cells after 2 days of treatment with DXd or DM1. b ADCP assessment of parental or CD47-KO KPL4 cells by human macrophages after 4 h co-culture. The percentage of macrophages containing fluorescent-labeled KPL4 was assessed by flow cytometry. ci Human macrophages co-culture with indicated KPL4 target cells and treatments for 2 days. Macrophage surface expression of c HLA-A2, d HLA-DR, e CD80, and f CD40 were assessed by flow cytometry. Inflammatory cytokines g TNFα, h IL-6, and chemokine (i) CCL4 secreted by macrophages assessed by ELISA. n Tumor antigen (eGFP) presentation to JEDI CD8 T cells using BMDM co-cultured with treated KPL4-eGFP or KPL4-eGFP-CD47-KO cells. Representative flow graphs for JEDI T-cell proliferation assessment by Cell-Trace (j) or T-cell activation assessment by CD44 staining (l) are shown for each treatment condition. k JEDI T-cell proliferation summary and m CD44 expression summary. am Two-way ANOVA with Tukey’s or Šidák’s multiple comparisons test (n = 3 per group in all experiments). Data presented as mean ± SEM with p values. MFI mean fluorescence intensity.
Fig. 8
Fig. 8. CD47 blockade enhances T-DXd anti-tumor efficacy in vivo.
a Tumor-bearing (>500 mm3) HER2-transgenic mice were treated weekly for the first four weeks with control IgG1 antibody (rituximab 10 mg/kg), T-DXd (5.4 mg/kg), anti-CD47 (see Methods) or in combination. Animal survival is plotted. Log-rank (Mantel-Cox) test between T-DXd monotherapy versus combination therapy (n = 15 per group). b Anti-tumor humoral responses in serum from mice in (a) were assessed by ELISA quantification of mouse IgG against HER2. Two-way ANOVA with Tukey’s multiple comparisons (n = 15). cf Intratumor macrophages (live CD45+/CD11b+/Gr1−/F/480+) analysis after 1 week of treatment with control IgG1 (n = 8), T-DXd (n = 7) or T-DXd plus anti-CD47 (n = 6). c Macrophage percentage, (d) phagocytosis of GFP+ tumor cells, (e) CD40 expression and (f) MHC-II expression were assessed by flow cytometry. gj Tumor-infiltrating CD8+ T cells (live CD45+/CD11b-/CD8+) analysis after 4 weeks of treatment with control IgG1 (n = 8), T-DXd (n = 12) or T-DXd plus anti-CD47 (n = 6). g Percentage of infiltrated CD8+ T cells. h CD107a cytotoxic marker expression. i naive CD8 T cells (CD62L+/CD44−). j Activated effector CD8 T cells (CD62L−/CD44+). k Immunohistochemistry assessment of tumor-infiltrating T cells levels and spatial location. CD8+ (brown), CD4+ (blue) and FoxP3+ (red), intratumor T cells (black arrows), T cells in stroma (green arrows) are shown for representative sections for each group. l Ratio of quantified CD8+ counts in tumor bed versus stroma in (k) (n = 5 per group). cl One-way ANOVA with Tukey’s multiple comparisons test. m HER2-transgenic mice with moderate tumor sizes (>150 mm3) were treated weekly with T-DXd (10 mg/kg) and anti-CD47. Complete tumor regressors were randomly assigned to CD8 depletion group or control depletion group. T-DXd and anti-CD47 treatments were halted, and mouse CD8 depletion antibodies (10 mg/kg) or PBS control were administered weekly. Tumor regression after combination therapy and relapse after CD8 depletion were monitored over time. Each line represents tumor growth from one animal subject. n Percentage of tumor-free animals in control versus CD8 depleted groups in (m). Log-rank (Mantel-Cox) test (n = 12). All data is presented as mean ± SEM with p values indicated.

References

    1. Dumontet, C., Reichert, J. M., Senter, P. D., Lambert, J. M. & Beck, A. Antibody-drug conjugates come of age in oncology. Nat. Rev. Drug Discov.22, 641–661 (2023). - PubMed
    1. Bournazos, S., Gupta, A. & Ravetch, J. V. The role of IgG Fc receptors in antibody-dependent enhancement. Nat. Rev. Immunol.20, 633–643 (2020). - PMC - PubMed
    1. Tsao, L. C., Force, J. & Hartman, Z. C. Mechanisms of therapeutic antitumor monoclonal antibodies. Cancer Res.81, 4641–4651 (2021). - PMC - PubMed
    1. Tsao, L. C. et al. CD47 blockade augmentation of trastuzumab antitumor efficacy dependent on antibody-dependent cellular phagocytosis. JCI Insight4, 10.1172/jci.insight.131882 (2019). - PMC - PubMed
    1. Sheyi, R., de la Torre, B. G. & Albericio, F. Linkers: an assurance for controlled delivery of antibody-drug conjugate. Pharmaceutics14, 10.3390/pharmaceutics14020396 (2022). - PMC - PubMed

MeSH terms