. 2025 Apr 2;15(1):11327.
doi: 10.1038/s41598-025-95990-z.

Oxygen level alters energy metabolism in bovine preimplantation embryos

Affiliations

Oxygen level alters energy metabolism in bovine preimplantation embryos

Nina Boskovic et al. Sci Rep. .

Abstract

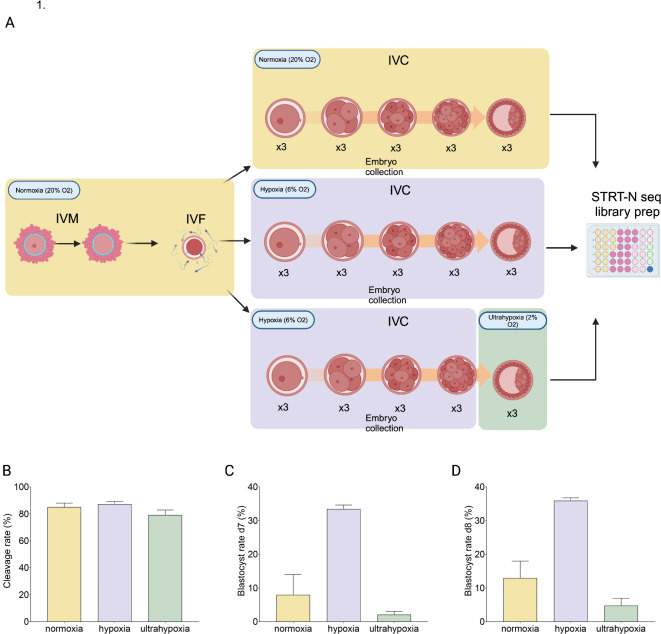
Mammalian preimplantation embryo development is a complex sequence of events. This period of development is sensitive to oxygen (O2) levels that can affect various cellular processes. We compared the influence of O2 tension by culturing embryos either in normoxic (20% O2) or physiological hypoxic (6% O2) conditions, or sequential low O2 concentration starting with 6% O2 until 16-cell stage and then switching to ultrahypoxic conditions (2% O2). Due to ethical concerns, we used bovine as an animal model with a good similarity of embryogenesis to human. We found that the cleavage rate was not affected by O2 levels but there was a clear difference in blastocyst formation rate. In hypoxia, 36% of embryos reached blastocyst stage while in normoxia only 13%. In ultrahypoxia conditions only 4.6% of embryos developed up to blastocyst stage. Transcriptomic profiles showed that normoxic conditions slowed down oocyte transcript degradation which is a prerequisite for reprogramming of the embryonic cell lineages. There were also clear differences in the expression of key metabolic enzymes between hypoxic and normoxic conditions at the blastocyst stage. Both hypoxic and ultrahypoxic conditions seemed to induce appropriate energy production by upregulating genes involved in glycolysis and lipid metabolism typical to in vivo embryos. In contrast, normoxic conditions failed to upregulate glycolysis genes and only depended on oxidative phosphorylation metabolism. We conclude that constant hypoxia culture of in vitro embryos provided the highest blastocyst formation rate and appropriate energy metabolism. Normoxia altered the energy metabolism and decreased the blastocyst formation rate. Even though ultrahypoxia at blastocyst stage resulted in the lowest blastocyst formation, the transcriptional profile of surviving embryos was normal.


Conflict of interest statement

Declarations. Competing interests: The authors declare no competing interests.

Figures

Fig. 1
Fig. 1
Study design and laboratory parameters. (A) Three different experimental conditions were tested. In normoxia in vitro maturation (IVM), in vitro fertilization (IVF) and in vitro culture (IVC) were performed at 20% O2. Three embryos per developmental stages: zygotes, 4-cell, 8-cell, 16-cell and blastocysts were collected and placed in a 48-well plate containing cell lysis buffer for STRT-N seq. Hypoxia condition had the same experimental design, but O2 concentration used was 6%. Third condition was done by performing IVC until 16-cell stage at hypoxia 6% and then the O2 concentration was lowered to 2% O2 until blastocyst stage. Embryo collection in this experiment was done both during hypoxia stages, and blastocysts for ultrahypoxia were collected and placed in the same STRT-N seq cell lysis plate. (B) Cleavage rate of all embryos at all conditions was calculated 24 h after the zygotes were placed in the IVC. (C) Blastocyst formation rate on day 7 of the embryo culture was calculated including the expanded and hatched blastocysts. (D) Blastocyst formation rate on day 8 of the embryo culture was calculated including the expanded and hatched blastocysts. Blastocyst formation rates were calculated based on the number of presumptive zygotes. Error bars represent +/- SEM. Figure created with BioRender.
Fig. 2
Fig. 2
Quality control of RNA seq library and unsupervised sample clustering. (A) Violin plots for gene expression of selected genes across different embryo development stages. Housekeeping genes ACTB, ACTG1, ACTG2, TUBA1B and TUBA1C show the expected variations in the gene expression across the development stages. The developmentally important genes NANOG, POU5F1, GFD9 and SLC34A were selected for gene expression trends in this RNA sequencing library. Y-axis presents log-normalized expression levels. (B) Unsupervised clustering was performed with R Seurat package. The UMAP plot shows that the earlier stages of embryo development cluster together and separately from the later stages: 16-cell stage and blastocyst embryos.
Fig. 3
Fig. 3
Visual demonstration of the embryonic genome activation (EGA) in bovine embryos. (A) The track shows the transcriptional changes of embryos grown under hypoxia. The top left graph shows the differences between 8-cell stage embryos and zygotes demonstrating the first downregulation of the maternal genes (brown). On the right, we see the comparison of 16-cell embryos to zygotes, and we can see the major EGA wave in bovine, where the majority of genes is downregulated (brown) and first upregulation of the newly formed embryo transcripts appears (green). Nonsignificant changes are shown in grey. (B) The track shows the transcriptional changes of embryos grown under normoxia. Bottom left graph presents comparison of 8-cell stage embryos against zygotes, with first downregulation of genes (brown), while the right graph demonstrates the transcriptomic changes in 16-cell stage embryos against zygotes. Downregulated genes are in brown, nonsignificant in grey, and upregulated genes in green. For the genes to be significantly downregulated or upregulated, the FDR of 5% was used.
Fig. 4
Fig. 4
Differences in the transcription profile of 16-cell embryos grown under hypoxia and normoxia. (A) Venn-Diagram of the upregulated genes at the 16-cell stage embryos against zygotes in hypoxia and normoxia. (B) Venn-Diagram of the downregulated genes at the 16-cell stage embryos against zygotes in hypoxia and normoxia. (C) Gene Ontology (GO) analysis of the genes upregulated at the 16-cell stage in hypoxia. The GO analysis includes molecular function (MF), biological processes (BP) and reactome (REAC). X-axis shows the number of genes that are identified under the GO term. (D) Kyoto Encyclopedia of Genes and Genomes (KEGG) analysis of the downregulated genes at the 16-cell stage in hypoxia. (E) GO analysis of the genes upregulated at the 16-cell stage in normoxia. This GO analysis includes MF, BP and REAC features. X-axis shows the number of genes that are identified under the GO term. (F) KEGG analysis of the downregulated genes in normoxia. For term and pathway in GO and KEGG analysis, a significance threshold of 5% FDR was used.
Fig. 5
Fig. 5
Comparison of blastocysts transcriptomic profiles grown under hypoxia, normoxia and ultrahypoxia. (A) Volcano plot representation of the transcriptional difference in the blastocysts grown under hypoxia against 16-cell stage hypoxia embryos. (B) Volcano plot representation of the transcriptional difference in the blastocysts grown under normoxia against 16-cell stage normoxia embryos. (C) Volcano plot representation of the transcriptional difference in the blastocysts grown under ultrahypoxia against 16-cell stage hypoxia embryos. Downregulated genes are shown in brown, not significant in grey and upregulated genes in green. (D) Number of differentially expressed genes (DEG) in blastocysts against 16-cell embryos across the 3 experimental conditions. (E) Chord diagram of the KEGG pathways upregulated at the blastocysts stage against 16-cell stage embryos in all 3 conditions, showing which KEGG pathways are shared between all 3 conditions (pink), only in hypoxia and ultrahypoxia (beige), only in hypoxia (purple), only in ultrahypoxia (green) and only in normoxia (yellow) marked as NO on the figure.

References

    1. Donjacour, A., Liu, X., Lin, W., Simbulan, R. & Rinaudo, P. F. In vitro fertilization affects growth and glucose metabolism in a Sex-Specific manner in an outbred mouse Model1. Biol. Reproduct.90 (2014). - PMC - PubMed
    1. Sun, W. J. et al. Exogenous glutathione supplementation in culture medium improves the bovine embryo development after in vitro fertilization. Theriogenology84, 716–723 (2015). - PubMed
    1. Wang, H. et al. Effects of changing culture medium on preimplantation embryo development in rabbit. Zygote30, 338–343 (2022). - PubMed
    1. Pasquariello, R. et al. Lipid-enriched reduced nutrient culture medium improves bovine blastocyst formation. Reprod. Fertil. 4, e230057 (2023). - PMC - PubMed
    1. Kleijkers, S. H. M. et al. Influence of embryo culture medium (G5 and HTF) on pregnancy and perinatal outcome after IVF: A multicenter RCT. Hum. Reprod.31, 2219–2230 (2016). - PubMed

LinkOut - more resources