

Microglial TLR4-Lyn kinase is a critical regulator of neuroinflammation, Aβ phagocytosis, neuronal damage, and cell survival in Alzheimer's disease
- PMID: 40175501
- PMCID: PMC11965285
- DOI: 10.1038/s41598-025-96456-y
Microglial TLR4-Lyn kinase is a critical regulator of neuroinflammation, Aβ phagocytosis, neuronal damage, and cell survival in Alzheimer's disease
Abstract
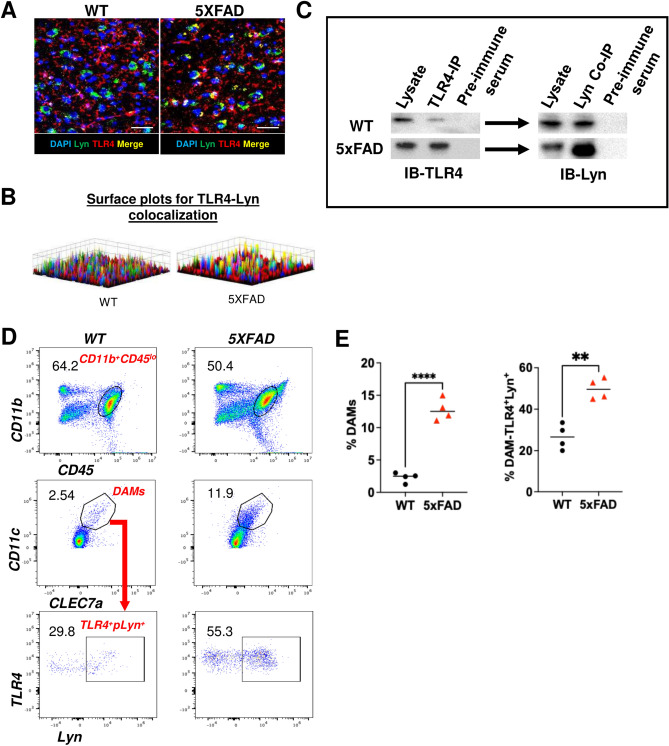
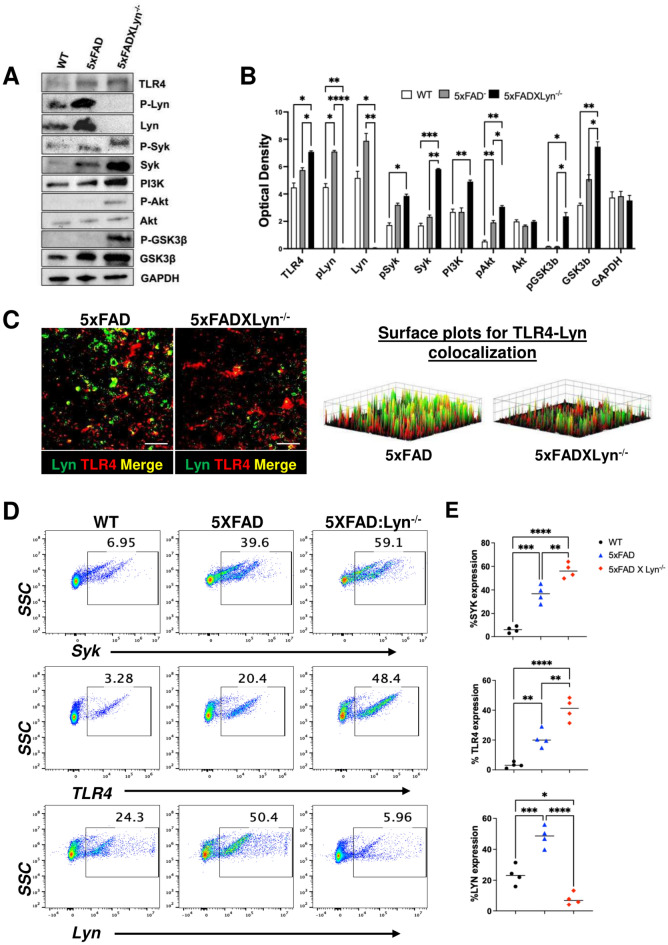
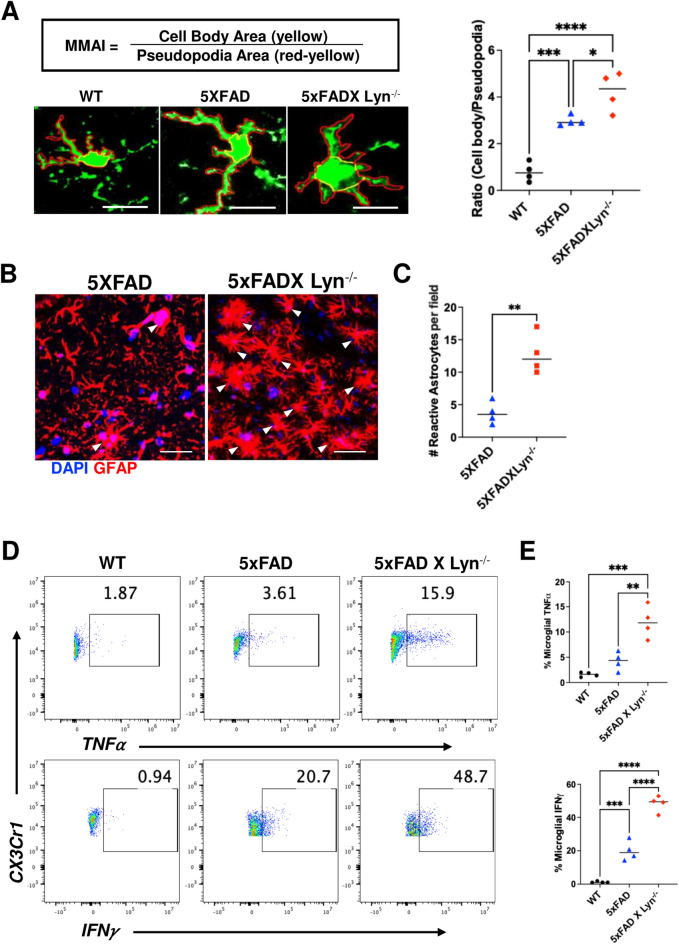
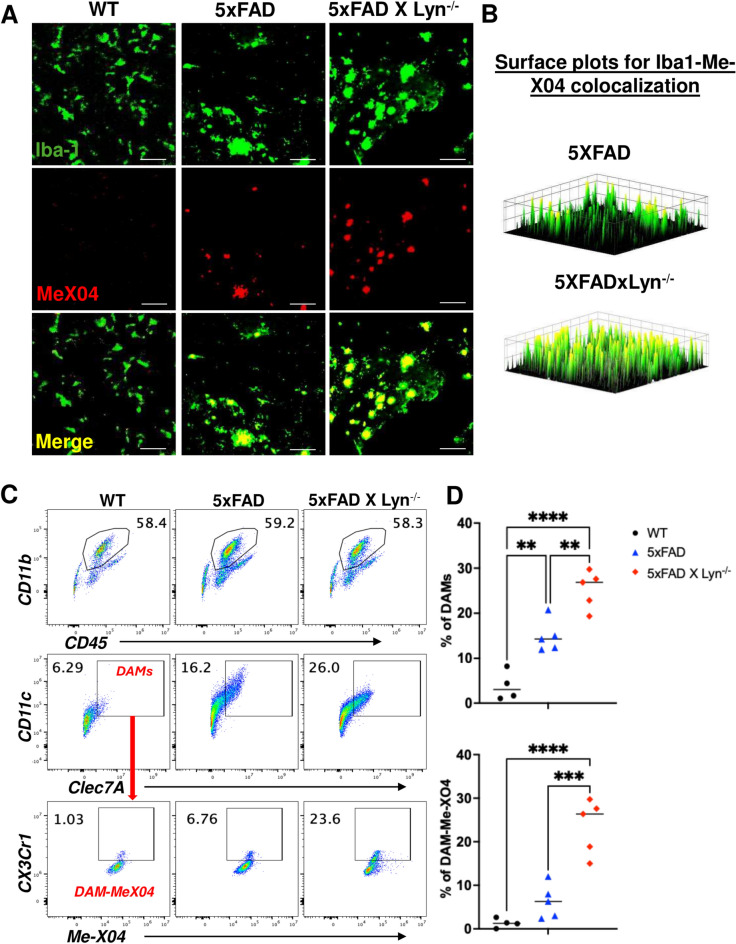
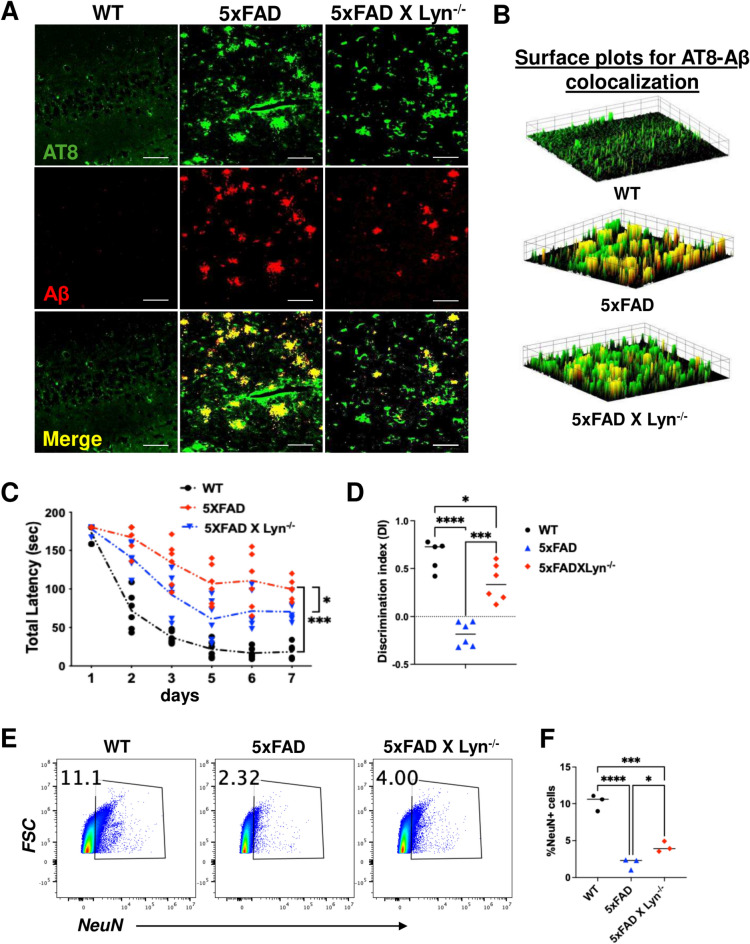
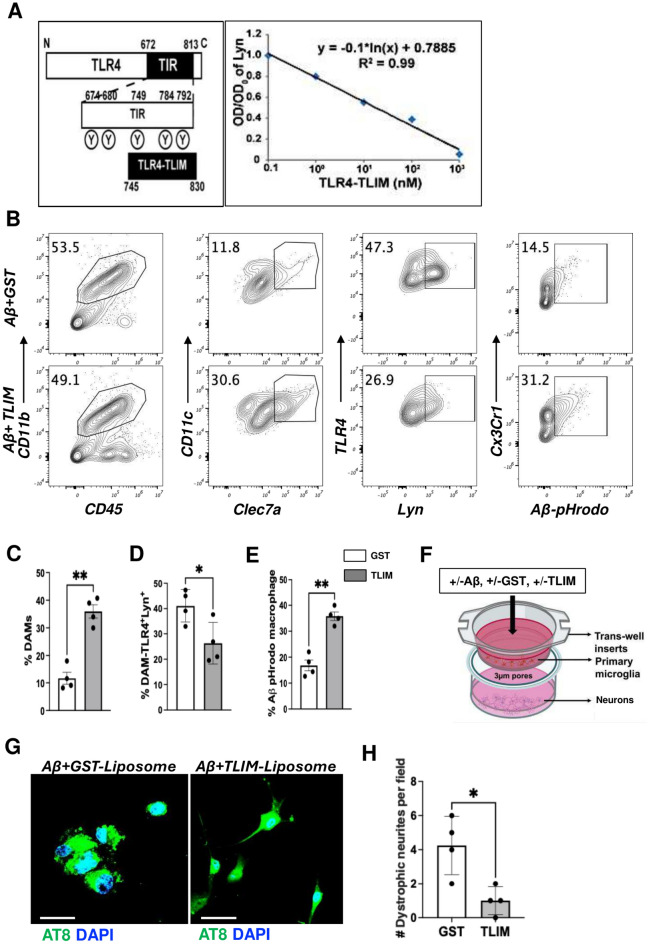
Disease-Associated Microglia (DAM) are a focus in Alzheimer's disease (AD) research due to their central involvement in the response to amyloid-beta plaques. Microglial Toll-like receptor 4 (TLR4) is instrumental in the binding of fibrillary amyloid proteins, while Lyn kinase (Lyn) is a member of the Src family of non-receptor tyrosine kinases involved in immune signaling. Lyn is a novel, non-canonical, intracellular adaptor with diverse roles in cell-specific signaling which directly binds to TLR4 to modify its function. Lyn can be activated in response to TLR4 stimulation, leading to phosphorylation of various substrates and modulation of inflammatory and phagocytosis signaling pathways. Here, we investigated the TLR4-Lyn interaction in neuroinflammation using WT, 5XFAD, and 5XFAD x Lyn-/- mouse models by western blotting (WB), co-immunoprecipitation (co-IP), immunohistochemistry (IHC) and flow cytometric (FC) analysis. A spatial transcriptomic analysis of microglia in WT, 5XFAD, and 5XFAD x Lyn-/- mice revealed essential genes involved in neuroinflammation, Aβ phagocytosis, and neuronal damage. Finally, we explored the effects of a synthetic, TLR4-Lyn modulator protein (TLIM) through an in vitro AD model using primary murine microglia. Our WB, co-IP, IHC, and FC data show an increased, novel, direct protein-protein interaction between TLR4 and Lyn kinase in the brains of 5XFAD mice compared to WT. Furthermore, in the absence of Lyn (5XFAD x Lyn-/- mice); increased expression of protective Syk kinase was observed, enhanced microglial Aβ phagocytosis, increased astrocyte activity, decreased neuronal dystrophy, and a further increase in the cell survival signaling and protective DAM population was noted. The DAM population in 5XFAD mice which produce more inflammatory cytokines and phagocytose more Aβ were observed to express greater levels of TLR4 and Lyn. Pathway analysis comparison between WT, 5XFAD, and 5XFAD x Lyn-/- mice supported these findings via our microglial spatial transcriptomic analysis. Finally, we created an in vitro co-culture system with primary murine microglial and primary murine hippocampal cells exposed to Aβ as a model of AD. When these co-cultures were treated with our TLR4-Lyn Interaction Modulators (TLIMs), an increase in Aβ phagocytosis and a decrease in neuronal dystrophy was seen. Lyn kinase has a central role in modulating TLR4-induced inflammation and Syk-induced protection in a 5XFAD mouse model. Our TLIMs ameliorate AD sequalae in an in vitro model of AD and could be a promising therapeutic strategy to treat AD.
Keywords: 5XFAD; Alzheimer’s disease; Disease-Associated Microglia; Lyn kinase; TLR4; TLR4-Lyn modulator protein.
© 2025. The Author(s).
Conflict of interest statement
Declarations. Competing interests: The authors declare no competing interests.
Figures

Similar articles
-
Gender differences in Alzheimer's may be associated with TLR4-LYN expression in damage associated microglia and neuronal phagocytosis.J Cell Physiol. 2024 Jun;239(6):e30916. doi: 10.1002/jcp.30916. Epub 2022 Nov 21. J Cell Physiol. 2024. PMID: 36409648 Free PMC article.
-
Macrophage Lyn Kinase Is a Sex-Specific Regulator of Post-Subarachnoid Hemorrhage Neuroinflammation.J Am Heart Assoc. 2025 May 6;14(9):e039409. doi: 10.1161/JAHA.124.039409. Epub 2025 Apr 25. J Am Heart Assoc. 2025. PMID: 40281655 Free PMC article.
-
The S1P receptor 1 antagonist Ponesimod reduces TLR4-induced neuroinflammation and increases Aβ clearance in 5XFAD mice.EBioMedicine. 2023 Aug;94:104713. doi: 10.1016/j.ebiom.2023.104713. Epub 2023 Jul 20. EBioMedicine. 2023. PMID: 37480622 Free PMC article.
-
TLR4 Cross-Talk With NLRP3 Inflammasome and Complement Signaling Pathways in Alzheimer's Disease.Front Immunol. 2020 Apr 23;11:724. doi: 10.3389/fimmu.2020.00724. eCollection 2020. Front Immunol. 2020. PMID: 32391019 Free PMC article. Review.
-
Amyloid β-Induced Inflammarafts in Alzheimer's Disease.Int J Mol Sci. 2025 May 10;26(10):4592. doi: 10.3390/ijms26104592. Int J Mol Sci. 2025. PMID: 40429737 Free PMC article. Review.
Cited by
-
LYN and CYBB are pivotal immune and inflammatory genes as diagnostic biomarkers in recurrent spontaneous abortion.Front Immunol. 2025 Jul 7;16:1568536. doi: 10.3389/fimmu.2025.1568536. eCollection 2025. Front Immunol. 2025. PMID: 40692778 Free PMC article.
-
Computational Insights into the Polypharmacological Landscape of BCR-ABL Inhibitors: Emphasis on Imatinib and Nilotinib.Pharmaceuticals (Basel). 2025 Jun 20;18(7):936. doi: 10.3390/ph18070936. Pharmaceuticals (Basel). 2025. PMID: 40732226 Free PMC article.
-
Bridging the brain and gut: neuroimmune mechanisms of neuroinflammation and therapeutic insights.Front Cell Neurosci. 2025 Jun 13;19:1590002. doi: 10.3389/fncel.2025.1590002. eCollection 2025. Front Cell Neurosci. 2025. PMID: 40584220 Free PMC article. Review.
References
MeSH terms
Substances
Grants and funding
LinkOut - more resources
Full Text Sources
Medical
Molecular Biology Databases
Miscellaneous
