. 2025 Jun;70(6):287-296.
doi: 10.1038/s10038-025-01331-3. Epub 2025 Apr 3.

Profiling of runs of homozygosity from whole-genome sequence data in Japanese biobank

Collaborators, Affiliations

Profiling of runs of homozygosity from whole-genome sequence data in Japanese biobank

Aye Ko Ko Minn et al. J Hum Genet. 2025 Jun.

Abstract

Runs of homozygosity (ROHs) are widely observed across the genomes of various species and have been reported to be associated with many traits and common diseases, as well as rare recessive diseases, in human populations. Although single nucleotide polymorphism (SNP) array data have been used in previous studies on ROHs, recent advances in whole-genome sequencing (WGS) technologies and the development of nationwide cohorts/biobanks are making high-density genomic data increasingly available, and it is consequently becoming more feasible to detect ROHs at higher resolution. In the study, we searched for ROHs in two high-coverage WGS datasets from 3552 Japanese individuals and 192 three-generation families (consisting of 1120 family members) in prospective genomic cohorts. The results showed that a considerable number of ROHs, especially short ones that may have remained undetected in conventionally used SNP-array data, can be detected in the WGS data. By filtering out sequencing errors and leveraging pedigree information, longer ROHs are more likely to be detected in WGS data than in SNP-array data. Additionally, we identified gene families within ROH islands that are associated with enriched pathways related to sensory perception of taste and odors, suggesting potential signatures of selection in these key genomic regions.


Conflict of interest statement

Competing interests: The authors declare no competing interests.

Figures
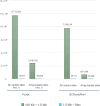
Fig. 1
Fig. 1
Distribution of total numbers of ROHs in 3.5KJPNv2 dataset among all individuals. Bar graphs represent genome-wide all variant sites and OmniExpressExome array-based sites specific ROH distribution in 3.5KJPNv2 dataset based on the selected tools. “Het_1” denotes the use of default value 1 in PLINK “--homozyg-window-het”. Color scheme represents ROH segments length intervals: ROHs between 100 Kb and 1.5 Mb, and ROHs above 1.5 Mb
Fig. 2
Fig. 2
Distribution of mean number of ROH1500 (NROH) per individual in (A) 3.5KJPNv2 dataset and (B) BirThree dataset. Violin plot represents the distribution of mean number of ROH segments longer than 1.5 Mb across individuals in the 3.5KJPNv2 and BirThree dataset. Color schemes represent specific conditions: genomic regions and parameter adjustments in selected tools. PLINK “--homozyg-window-het” option values were set to a range of 1–4, i.e., allowing from one to four heterozygous calls per window. These are abbreviated as “Het_1”, “Het_2”, “Het_3”, and “Het_4”, respectively
Fig. 3
Fig. 3
Functional enrichment analysis of annotated genes within runs of homozygosity (ROH) Islands. This figure presents the results of functional enrichment analysis on genes identified within ROH islands located in shorter ROH regions (>100 KB), detected in the BirThree dataset via BCFtools (by setting 99.9th percentile threshold based on the frequencies of overlapping ROH100 regions shared among individuals). The gProfiler tool was utilized to identify enriched biological pathways (BP), molecular functions (MF), and cellular components (CC) from Gene Ontology (GO), KEGG, and Reactome. The y-axis displays the enrichment score, indicating statistical significance, while the x-axis and color coding represent the data source. Dot size corresponds to the number of genes associated with each term. A summary of comparative statistics with other dataset (3.5KJPNv2) and tool (PLINK) is also provided. Full figures and statistics related to all analysis can be found in Supplementary Figs. S2A–B and Tables S2A–F

References

    1. Cooke NP, Mattiangeli V, Cassidy LM, Okazaki K, Stokes CA, Onbe S, et al. Ancient genomics reveals tripartite origins of Japanese populations. Sci Adv. 2021;7:1–15. - PMC - PubMed
    1. Kirin M, McQuillan R, Franklin CS, Campbell H, Mckeigue PM, Wilson JF. Genomic runs of homozygosity record population history and consanguinity. PLoS One. 2010;5:e13996. - PMC - PubMed
    1. Ceballos FC, Hazelhurst S, Ramsay M. Assessing runs of Homozygosity: a comparison of SNP Array and whole genome sequence low coverage data. BMC Genomics. 2018;19:1–12. - PMC - PubMed
    1. Wright S. Coefficients of Inbreeding and Relationship Author (s): Sewall Wright Source: The American Naturalist, Vol. 56, No. 645 (Jul. - Aug., 1922), pp. 330-338 Published by: The University of Chicago Press for The American Society of Naturalists Sta. Am Nat. 1922;56:330–8.
    1. McQuillan R, Leutenegger AL, Abdel-Rahman R, Franklin CS, Pericic M, Barac-Lauc L, et al. Runs of homozygosity in European populations. Am J Hum Genet. 2008;83:359–72. - PMC - PubMed

Supplementary concepts

LinkOut - more resources