. 2025 Sep;30(9):3868-3884.
doi: 10.1038/s41380-025-02967-5. Epub 2025 Apr 2.

Sulforaphane protects developing neural networks from VPA-induced synaptic alterations

Affiliations

Sulforaphane protects developing neural networks from VPA-induced synaptic alterations

Riley N Bessetti et al. Mol Psychiatry. 2025 Sep.

Abstract

Prenatal brain development is particularly sensitive to chemicals that can disrupt synapse formation and cause neurodevelopmental disorders. In most cases, such chemicals increase cellular oxidative stress. For example, prenatal exposure to the anti-epileptic drug valproic acid (VPA), induces oxidative stress and synaptic alterations, promoting autism spectrum disorders (ASD) in humans and autism-like behaviors in rodents. Using VPA to model chemically induced ASD, we tested whether activation of cellular mechanisms that increase antioxidant gene expression would be sufficient to prevent VPA-induced synaptic alterations. As a master regulator of cellular defense pathways, the transcription factor nuclear factor erythroid 2-related factor 2 (NRF2) promotes expression of detoxification enzymes and antioxidant gene products. To increase NRF2 activity, we used the phytochemical and potent NRF2 activator, sulforaphane (SFN). In our models of human neurodevelopment, SFN activated NRF2, increasing expression of antioxidant genes and preventing oxidative stress. SFN also enhanced expression of genes associated with synapse formation. Consistent with these gene expression profiles, SFN protected developing neural networks from VPA-induced reductions in synapse formation. Furthermore, in mouse cortical neurons, SFN rescued VPA-induced reductions in neural activity. These results demonstrate the ability of SFN to protect developing neural networks during the vulnerable period of synapse formation, while also identifying molecular signatures of SFN-mediated neuroprotection that could be relevant for combatting other environmental toxicants.


Conflict of interest statement

Competing interests: The authors declare no competing interests.

Figures
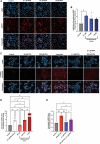
Fig. 1
Fig. 1. SFN attenuated VPA-induced ROS production in hNPCs.
A Representative confocal images of phosphorylated NRF2 (pNRF2) (red) and DAPI counterstain (blue) in hNPCs with increasing doses of SFN. White scale bar represents 100 μm. B Quantified pNRF2 area normalized to DAPI represented as fold change from control (N = 3 experiments; analyzed using one-way ANOVA (p = 0.0210) with Dunnett’s multiple comparisons test). C Representative widefield images of CellROX™ Deep Red indicating cellular ROS in hNPCs treated with increasing concentrations of VPA, 0.1 μM SFN, and co-treated with 0.1 μM SFN and 500 μM VPA. White scale bar represents 200 μm. D Quantified CellROX area normalized to DAPI area expressed as fold change from control group for VPA dose response with 2.5 μM positive menadione control (N = 3 experiments; analyzed using one-way ANOVA (p < 0.0001) with Uncorrected Fisher’s LSD Test). E Normalized CellROX area fold change for 500 μM VPA alone, 0.1 μM SFN alone, and co-treatment with 500 μM VPA and 0.1 μM SFN (N = 3 experiments; analyzed using one-way ANOVA (p = 0.0039) with Tukey’s multiple comparisons test). Data represented as mean ± SEM, **p < 0.01 and *p < 0.05.
Fig. 2
Fig. 2. Acute VPA exposure led to ASD associated transcriptional changes in human neural progenitor cells.
A Principal component analysis of hNPCs in control, 500 μM VPA, 0.1 μM SFN, and 500 μM VPA and 0.1 μM SFN co-treatment groups. B Volcano Plot of VPA vs Control showing statistically significant differentially expressed genes (DEGs) (padj > 0.05) above (red) and below (green) a threshold of log2fold change = 0.5 and unchanged genes (black). C, D Gene Ontology Biological Processes (GOBP) analysis of VPA-induced DEGs ordered by gene enrichment (ratio of the number of genes differentially expressed compared to total number of genes associated with that biological function) for down regulated C and up regulated D transcripts. E Overlap of VPA DEGs with ASD associated genes (SFARI), PsychENCODE ASD DEGs, and DEGs in ASD organoids derived from patient IPSCs.
Fig. 3
Fig. 3. The addition of SFN increases transcription of genes associated with synaptic structure, organization, and mitochondrial metabolic processes.
A Volcano Plot of hNPCs treated with VPA + SFN vs Control showing statistically significant DEGs above (red) and below (green) a threshold of log2fold change = 0.5 and unchanged genes (black). B, C GOBP analysis of DEGs in VPA + SFN treated hNPCs ordered by gene enrichment (ratio of the number of genes differentially expressed compared to total number of genes associated with that biological function) for down regulated B and up regulated C transcripts. D Comparison of the DEGs in VPA and VPA + SFN treated hNPCs showing 1338 shared DEGs between the data sets. E Overlap of VPA + SFN DEGs with ASD associated genes (SFARI), PsychENCODE ASD DEGs, and DEGs in ASD organoids derived from patient IPSCs. F GOBP analysis of the 408 DEGs down regulated in VPA treated hNPCs not shared with the VPA + SFN treatment. G GOBP analysis of the 502 DEGs up regulated in VPA + SFN treated hNPCs not shared with VPA elucidating potential mechanisms of SFN neuroprotection.
Fig. 4
Fig. 4. SFN treatment increased pNRF2 nuclear accumulation in hCSs.
A Representative confocal microscopy images of DAPI stained nuclei (blue) and pNRF2 (red) in human cortical spheroids (HCS) treated with VPA, SFN, VPA and SFN or VPA pre-treated with SFN (scale bar represents 50 μm). B Quantification of pNRF2 positive nuclei in each treatment group compared to control (Data represented as Mean ± SEM; N = 18 for control, VPA, SFN, and VPA + SFN, N = 9 for SFN pre-treatment + VPA; data analyzed using Kruskal-Wallis test (p = 0.0026) with Dunn’s multiple comparisons test; **p < 0.01 and *p < 0.05). C Percent distribution of pNRF2 positive and negative nuclei for all cells. Positive nuclei correlate to greater than 10% overlap with DAPI divided into groups with 10–25, 25–50, 50–75, or 75–100% overlap.
Fig. 5
Fig. 5. SFN mediated VPA-induced glutamatergic synaptic alterations.
A Representative confocal images of human cortical spheroids (hCSs) labeled with excitatory presynaptic marker VGLUT-1 (magenta) and postsynaptic marker PSD-95 (green) with fluorescently labeled actin (white) after 24-h treatment of 500 μM VPA, 0.1 μM SFN, 500 μM VPA and 0.1 μM SFN, or 24-h SFN pre-treatment followed by 24-h treatment with 500 μM VPA. Arrowheads indicate colocalization of VGLUT-1 and PSD-95 also shown as colocalized synapse mask (yellow). White scale bar in the control composite represents 50 μm in original image and 5 μm for inset of the enlarged ROI. All images are set to the same scale. B-G for each image we quantified the B normalized VGLUT-1/PSD-95 colocalized puncta (excitatory synapse) as area percent change from control, C VGLUT-1/PSD-95 colocalized puncta particle size, D normalized VGLUT-1 puncta area as percent change from control, E VGLUT-1 puncta particle size, F normalized PSD-95 puncta area as percent change from control, and G PSD-95 puncta particle size. H Representative confocal images of mouse cortical neurons (mCNs) labeled with excitatory presynaptic marker VGLUT-1 (magenta) and postsynaptic marker PSD-95 (green) with DAPI (blue) after 24-h treatment of 500 μM VPA, 0.1 μM SFN, 500 μM VPA and 0.1 μM SFN, or 24-h SFN pre-treatment followed by 24-h treatment with 500 μM VPA. White scale bar in the control composite represents 50 μm in original image and the inset is a 2.5× enlargement of the ROI. I-N for each image we quantified the I excitatory synapse area per nuclei as percent change from control, J VGLUT-1/PSD-95 colocalized puncta particle size, K normalized VGLUT-1 puncta area as percent change from control, L VGLUT-1 puncta particle size, M normalized PSD-95 puncta area as percent change from control, and N PSD-95 puncta particle size. Data were analyzed with Kruskal-Wallis test, B p = 0.0005; C p = 0.0026; D p = 0.6369; E p = 0.9571 F p < 0.0001; G p = 0.1739), I p = 0.0238; J p = 0.6889; K p = 0.0931; L p = 0.1473 M p = 0.0259; N p = 0.8761), followed by Dunn’s multiple comparisons test when p < 0.05 to determine statistical significance. In hCS data, N  =  18 micrographs, 3 each from 6 independent experiments analyzed per treatment group except for the 0.1 μM SFN pre-treatment + 500 μM VPA, which had N = 9 micrographs, 3 each from 3 independent experiments. In mCN data, N  =  9 micrographs, 3 each from 3 independent experiments analyzed per treatment group. ***p < 0.001, **p < 0.01, and *p < 0.05.
Fig. 6
Fig. 6. Sulforaphane rescues VPA-induced changes in synaptic activity in developing neural networks.
A Detailed schematic illustrating human cortical spheroid (hCS) experimental protocol for microelectrode array (MEA). B Detailed schematic outlining primary mouse cortical (mCN) experimental protocol for MEA. C, D Representative raster plots of hCS C and mCN D baseline activity measurements taken prior to drug treatment, black bars represent a single spike and blue bars represent bursts in which more than 5 action potentials occur with spikes no more than 100 ms apart. E–G Quantification of baseline synchrony metrics E computed in the neural metric tool as the normalized area under the cross-correlation, weighted mean firing rate (WMFR) F, and bursting frequency G for each culture. Data were analyzed using Mann-Whitney test (E-G p < 0.0001) (hCS N = 56; mCN N = 71 MEA wells). H hCS WMFR quantified for each treatment at 3 h H.a, 6 h H.b, 24 h H.c, and 24-h washout H.d normalized to baseline WMFR. Data were analyzed using Kruskal-Wallis test (all p > 0.05, N = 8–10 MEA wells per treatment). I mCN WMFR quantified for each treatment at 3 h I.a, 6 h I.b, 24 h I.c, 24-h washout I.d, and 21 (days in vitro) DIV I.e normalized to baseline WMRF. Data were analyzed using Kruskal-Wallis test with Dunn’s multiple comparison when p < 0.05, N = 17 or 18 MEA wells per treatment. Data represented as mean ± SEM, ****p < 0.0001, ***p < 0.001, **p < 0.01, and *p < 0.05.

References

    1. Dietert RR, Dietert JM, Dewitt JC. Environmental risk factors for autism. Emerg Health Threats J. 2011;4:7111. - PMC - PubMed
    1. Sealey LA, Hughes BW, Sriskanda AN, Guest JR, Gibson AD, Johnson-Williams L, et al. Environmental factors in the development of autism spectrum disorders. Environ Int. 2016;88:288–98. - PubMed
    1. Yenkoyan K, Mkhitaryan M, Bjørklund G. Environmental risk factors in autism spectrum disorder: a narrative review. Curr Med Chem. 2024;31:2345–60. - PubMed
    1. Bölte S, Girdler S, Marschik PB. The contribution of environmental exposure to the etiology of autism spectrum disorder. Cell Mol Life Sci. 2019;76:1275–97. - PMC - PubMed
    1. Liu X, Lin J, Zhang H, Khan NU, Zhang J, Tang X, et al. Oxidative stress in autism spectrum disorder—current progress of mechanisms and biomarkers. Front Psychiatry. 2022;13:813304. - PMC - PubMed

MeSH terms

LinkOut - more resources