. 2025 May;641(8061):144-150.
doi: 10.1038/s41586-025-08793-7. Epub 2025 Apr 2.

Ancient DNA from the Green Sahara reveals ancestral North African lineage

Affiliations

Ancient DNA from the Green Sahara reveals ancestral North African lineage

Nada Salem et al. Nature. 2025 May.

Abstract

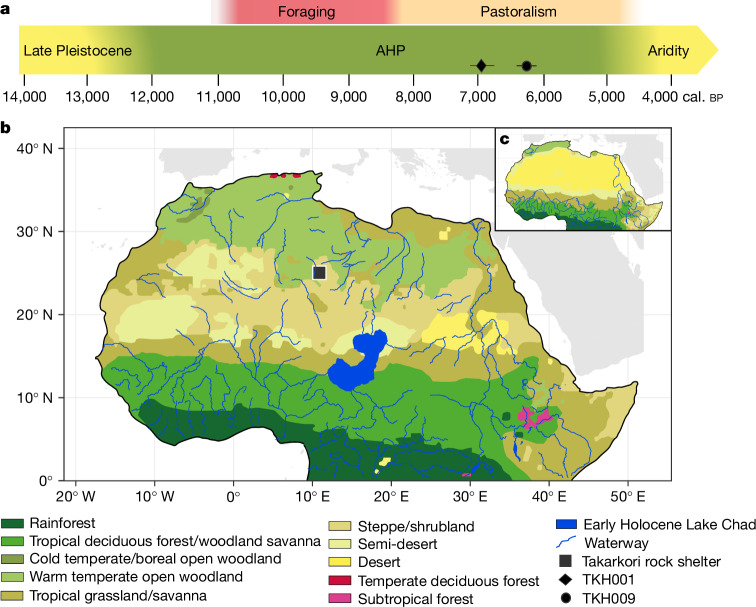
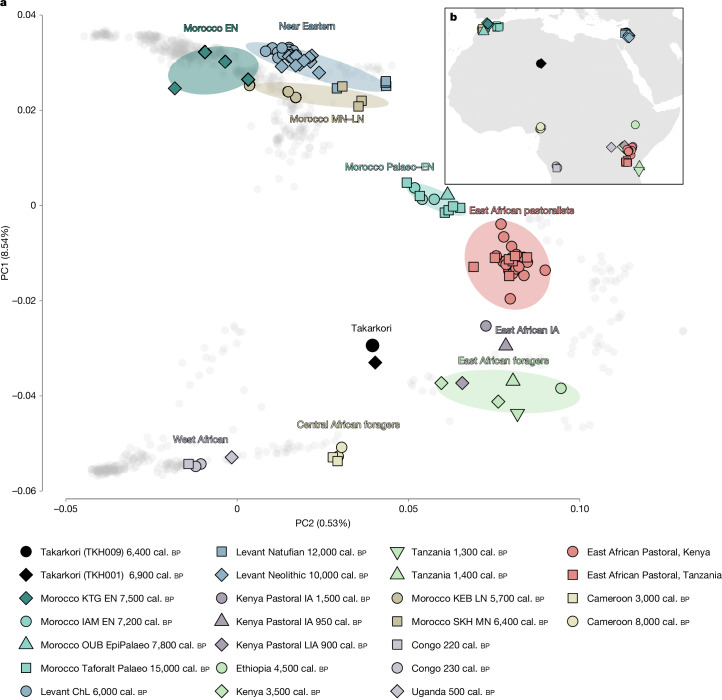
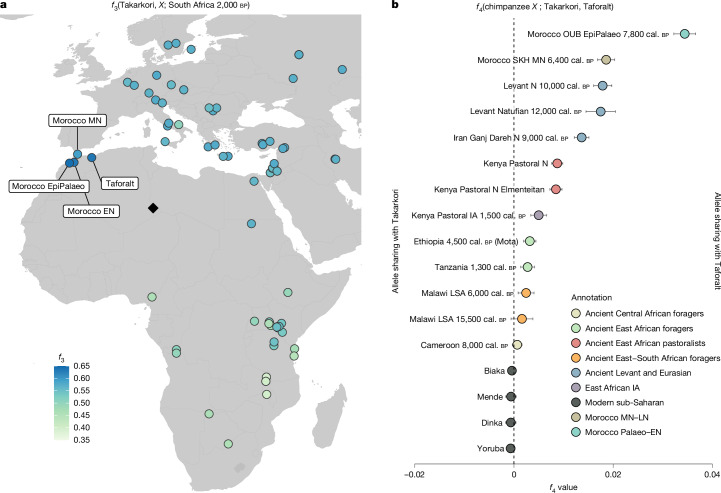
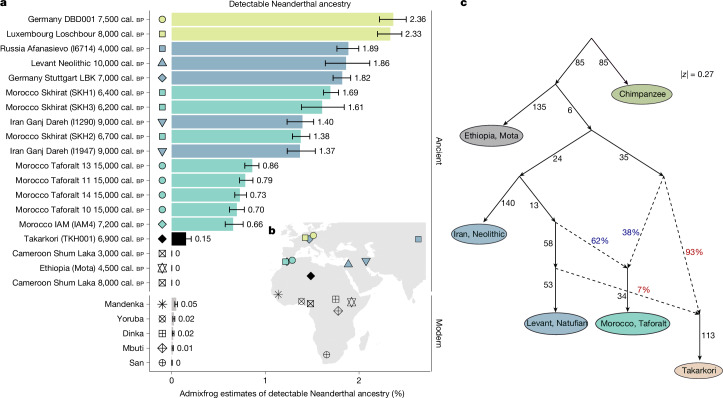
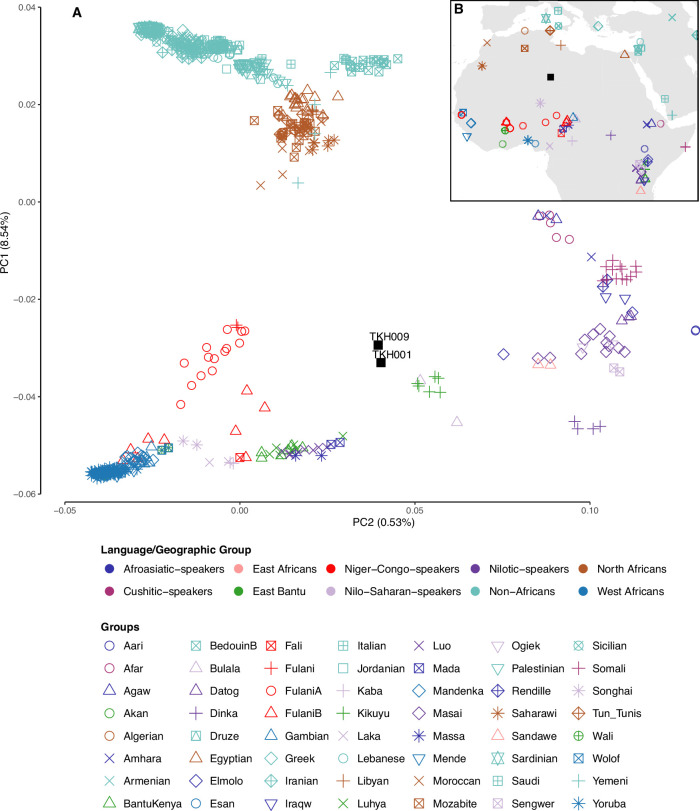
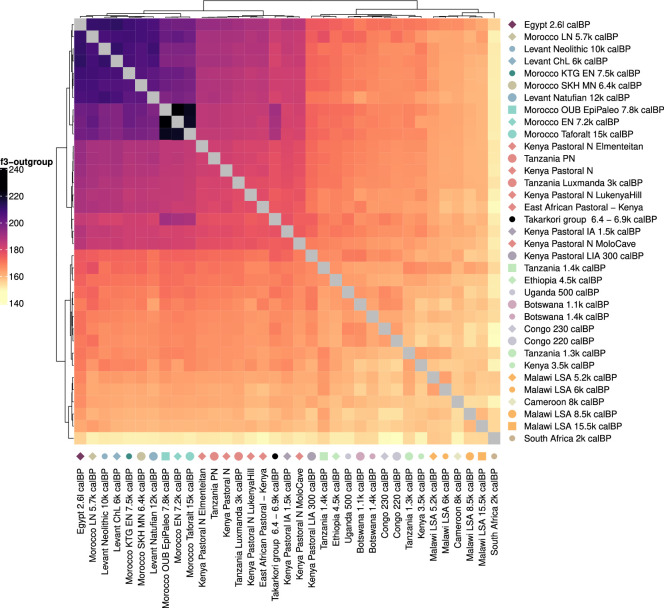
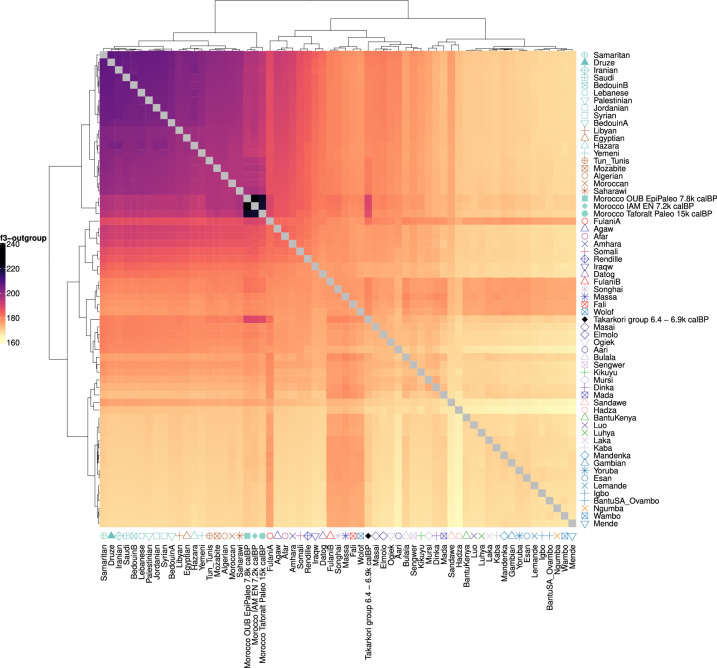
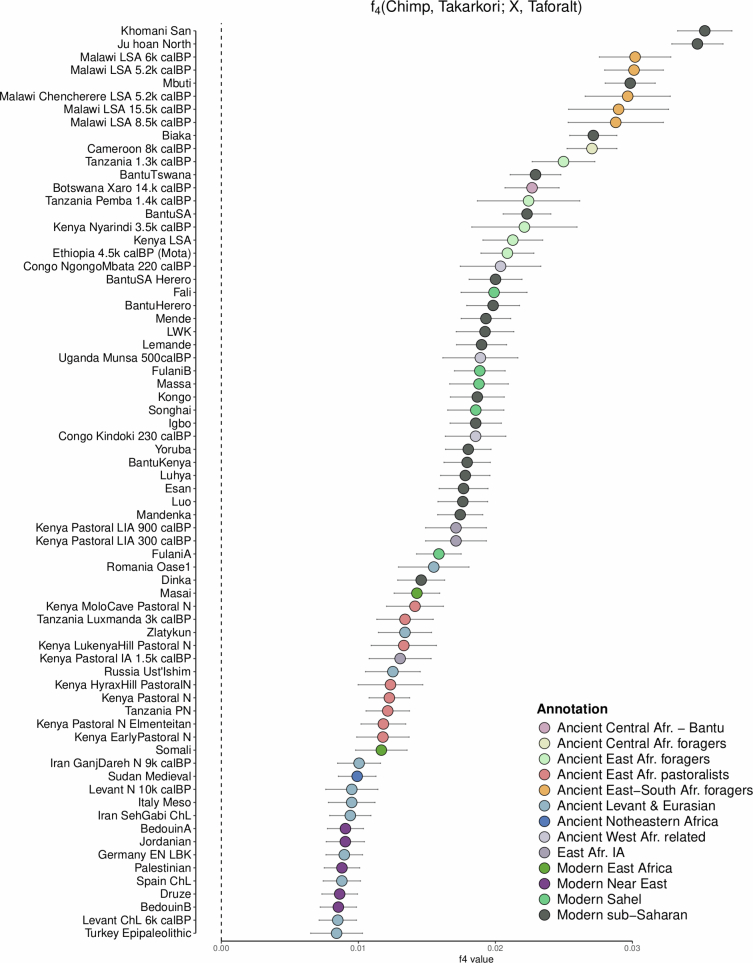
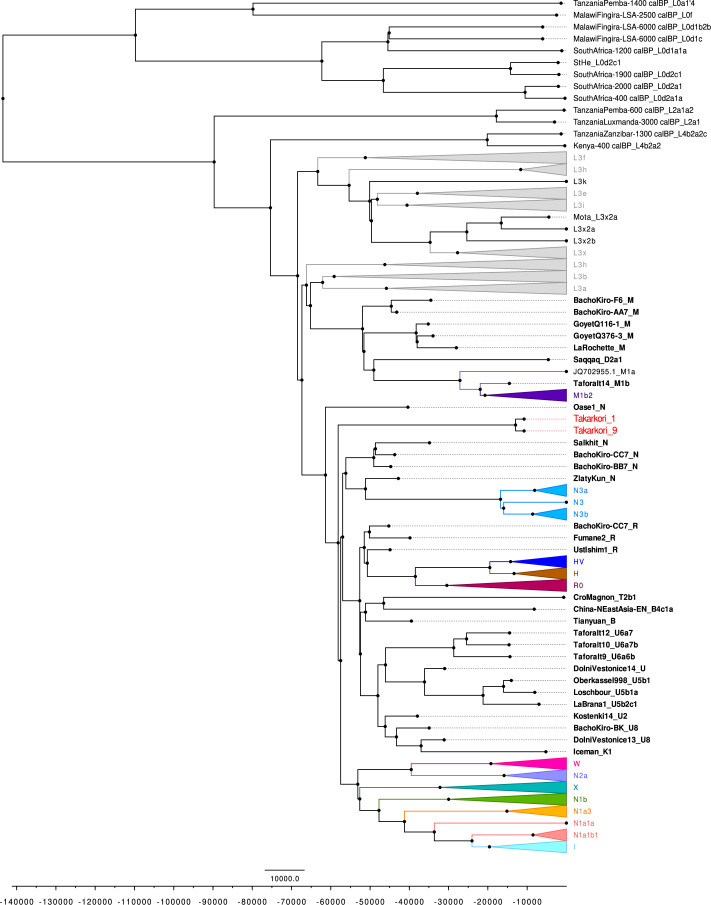
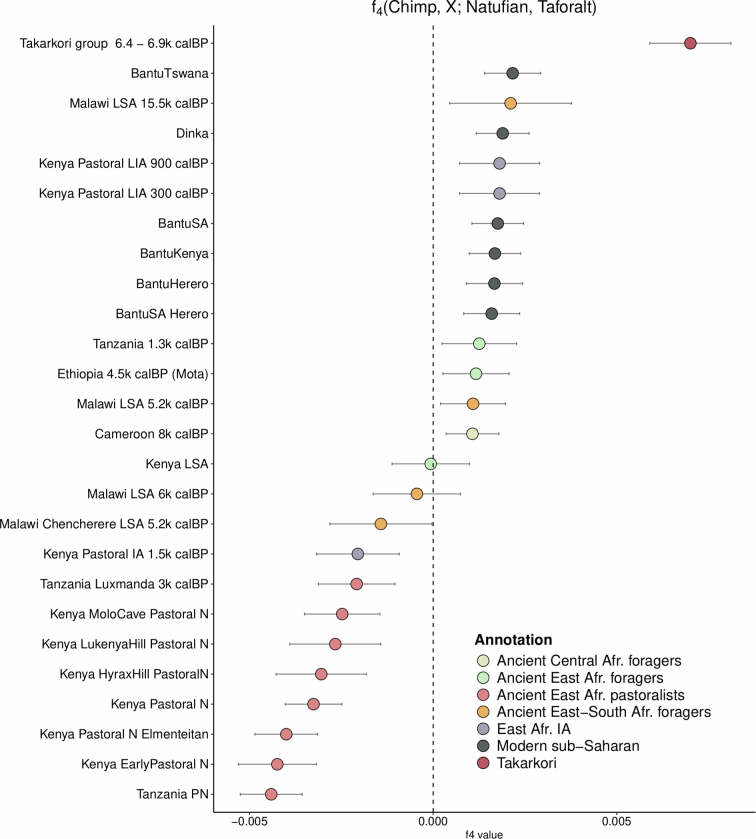
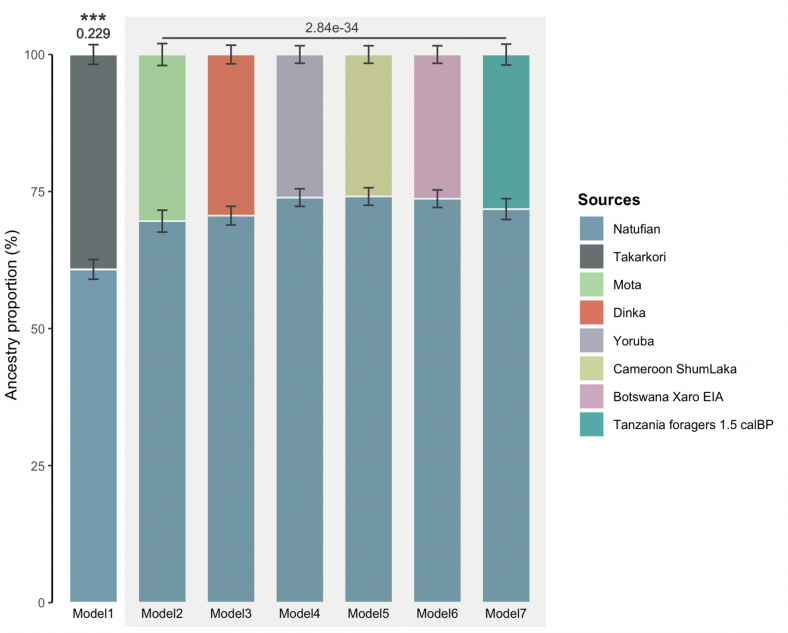
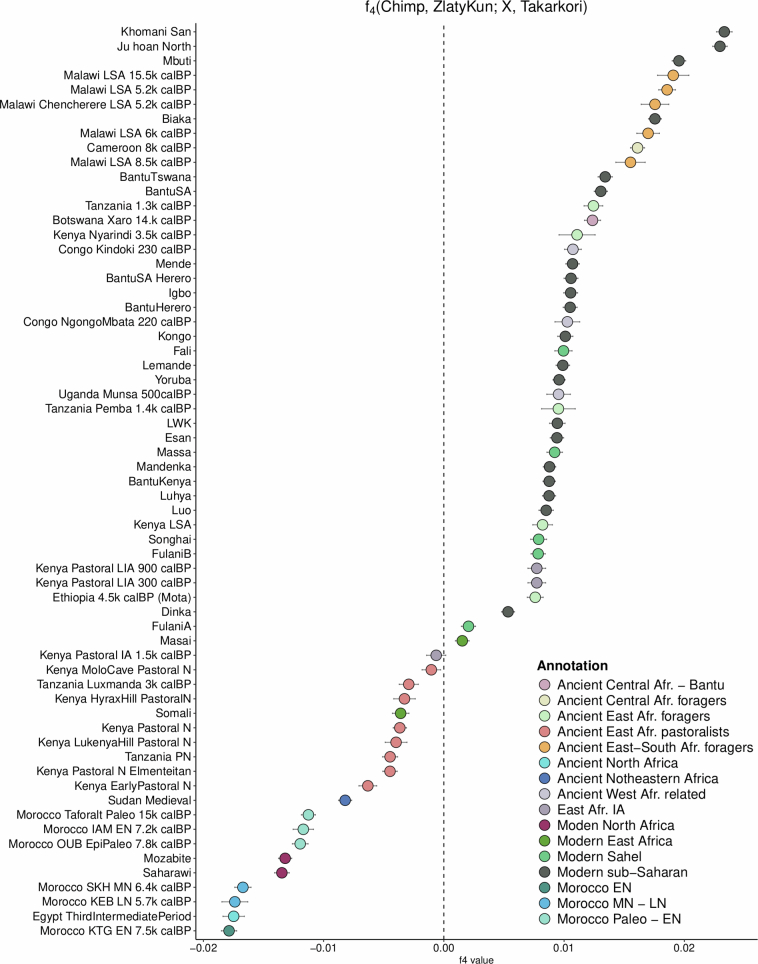
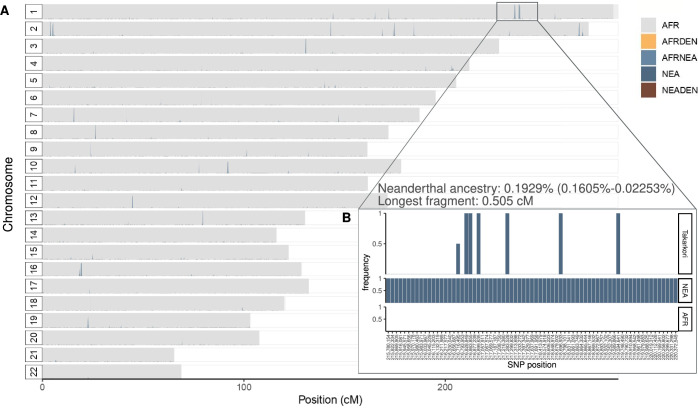
Although it is one of the most arid regions today, the Sahara Desert was a green savannah during the African Humid Period (AHP) between 14,500 and 5,000 years before present, with water bodies promoting human occupation and the spread of pastoralism in the middle Holocene epoch1. DNA rarely preserves well in this region, limiting knowledge of the Sahara's genetic history and demographic past. Here we report ancient genomic data from the Central Sahara, obtained from two approximately 7,000-year-old Pastoral Neolithic female individuals buried in the Takarkori rock shelter in southwestern Libya. The majority of Takarkori individuals' ancestry stems from a previously unknown North African genetic lineage that diverged from sub-Saharan African lineages around the same time as present-day humans outside Africa and remained isolated throughout most of its existence. Both Takarkori individuals are closely related to ancestry first documented in 15,000-year-old foragers from Taforalt Cave, Morocco2, associated with the Iberomaurusian lithic industry and predating the AHP. Takarkori and Iberomaurusian-associated individuals are equally distantly related to sub-Saharan lineages, suggesting limited gene flow from sub-Saharan to Northern Africa during the AHP. In contrast to Taforalt individuals, who have half the Neanderthal admixture of non-Africans, Takarkori shows ten times less Neanderthal ancestry than Levantine farmers, yet significantly more than contemporary sub-Saharan genomes. Our findings suggest that pastoralism spread through cultural diffusion into a deeply divergent, isolated North African lineage that had probably been widespread in Northern Africa during the late Pleistocene epoch.


Conflict of interest statement

Competing interests: The authors declare no competing interests.

Figures

Fig. 1
Fig. 1. Chronology of the ecozones and subsistence strategies in the broader Sahara region.
a, Timeline of climate phases and subsistence strategies during the late Pleistocene and the Holocene in North-East Africa and Central Sahara. The radiocarbon dates for both Takarkori individuals are given by the black diamond and circle. b,c, The distribution of ecozones in Northern Africa in the Green Sahara period during the early Holocene 9,000 years ago (b) and in recent times (1901–1930) (c) using the dynamic vegetation model Carbon Assimilation in the Biosphere (CARAIB). The location of the Takarkori rock shelter site is marked with a black square. The maps are adapted from refs. and under a Creative Commons licence CC BY 4.0.
Fig. 2
Fig. 2. PCA calculated on present-day individuals from Africa, the Near East and Southern Europe, and the geographical locations of these individuals.
a, PCA with projecting key ancient groups from the region (Supplementary Data 3). b, The geographical locations of ancient genomes from Africa and the Near East included in our analysis. ChL, Chalcolithic; EN, Early Neolithic; EpiPalaeo, Epipalaeolithic; IA, Iron Age; IAM, Ifri n’Amr o’Moussa; KEB, Kehf el Baroud; KTG, Kaf Taht el-Ghar; LIA, Late Iron Age; LN, Late Neolithic; MN, Middle Neolithic; OUB, Ifri Ouberrid; Palaeo, Palaeolithic; SKH, Skhirat-Rouazi.
Fig. 3
Fig. 3. Shared genetic drift and affinity with Takarkori genomes.
a, Outgroup-f3 statistics f3(Takarkori, X; South Africa 2,000 cal. bp), where X represents ancient groups, mapped at their geographical positions. The colour gradient from blue to green indicates the genetic proximity to Takarkori, with the bluer colours representing closer genetic relationships. The statistics and their associated s.e. values for the top 70 signals are presented in Supplementary Fig. 2.12. b, No group shares extra affinity with Takarkori genomes compared with Taforalt, as measured by f4 statistics of the form f4(chimpanzee, X; Takarkori, Taforalt). The error bars represent 3 s.e. Group colours follow the same scheme as in Fig. 2. A more extensive list is presented in Supplementary Fig. 2.19. LSA, Late Stone Age; N, neolithic.
Fig. 4
Fig. 4. Neanderthal ancestry and admixture graph.
a, Detectable Neanderthal ancestry in segments longer than 0.05 cM in ancient individuals from Africa and Eurasia, along with present-day sub-Saharan African groups. The error bars represent the minimum and maximum estimates from all iterations. b, The geographical locations of groups included in the analysis. c, Admixture graph modelling of Takarkori’s ancestral relationship with relevant populations.
Extended Data Fig. 1
Extended Data Fig. 1. PCA calculated on present-day individuals from the whole of the African continent, the Near East, and Southern Europe.
A) with projections of key ancient groups from these regions. B) Geographic locations of ancient genomes from Africa and Near East included in our analysis. EN: Early Neolithic, LN: Late Neolithic, ChL: Chalcolithic, LSA: Late Stone Age, IA: Iron Age.
Extended Data Fig. 2
Extended Data Fig. 2. PCA calculated on present-day individuals from West and East Africa, the Sahel, the Near East, and Southern Europe.
A) with Takarkori individuals projected and highlighted in black squares. B) Geographic locations of Takarkori individuals and relevant present-day populations included in our analysis.
Extended Data Fig. 3
Extended Data Fig. 3. Outgroup-f3(Chimp; X1, X2) statistics, where X represents relevant ancient populations from Africa and the Near East.
Within the shared drift of Takarkori group, the highest genetic drift is exhibited with Taforalt-related groups, OUB and IAM. The colour scheme for populations in the legend follows that of PCA Fig. 1. The error bars represent three standard errors.
Extended Data Fig. 4
Extended Data Fig. 4. Outgroup-f3(Chimp; X1, X2) statistics, where X represents relevant modern populations from Africa and the Near East.
The Taforalt and later Epipaleolithic and Neolithic groups from Morocco are included for comparison due to their highest genetic drift with Takarkori. The Takarkori group shows the second highest affinity with FulaniA after Taforalt-related groups. The colour and shape scheme for populations in the legend follows that of the PCA in Extended Data Fig. 1. The error bars represent three standard errors.
Extended Data Fig. 5
Extended Data Fig. 5. Results of f4(Chimp, Takarkori, X, Taforalt) analysis with X representing various ancient and modern populations from Africa and the Near East.
All positive f4 values underscore shared genetic drift between Takarkori and Taforalt that surpasses other potential affinities tested here. The error bars represent three standard errors.
Extended Data Fig. 6
Extended Data Fig. 6. Bayesian Mitochondrial phylogeny of Takarkori samples and comparative genomes.
The phylogenetic tree is constructed for the Takarkori samples TKH001 and TKH009, combined with 209 published complete genomes from ancient and modern samples. The major mitochondrial lineages and sub-lineages for the N macrohaplogroup are differentiated by distinct colours.
Extended Data Fig. 7
Extended Data Fig. 7. Results of f4(Chimp, X, Natufian, Taforalt) analysis with X representing various ancient African groups.
Takarkori exhibits a notably higher affinity to Taforalt, with an f4 value approximately 3.5 times higher than the next closest African group. The error bars represent three standard errors.
Extended Data Fig. 8
Extended Data Fig. 8. qpAdm analysis of the Taforalt group.
Results of modelling the Taforalt group as a two-way admixture between Natufian and various African populations. Takarkori yielded the best model fit with a P-value > 0.05, indicating the sufficiency of the two-way admixture model for Taforalt. In contrast, the P-values for the other models were all <2.84 × 10⁻³⁴. The error bars represent the standard error of the ancestry proportion estimates, calculated using 5 cM block jackknifing.
Extended Data Fig. 9
Extended Data Fig. 9. Assessment of Takarkori’s affinity with OoA ancestry, represented by Zlatý kůň, versus various African groups.
The results suggest a stronger connection between Takarkori and the OoA ancestry compared to sub-Saharan Africans. The error bars represent three standard errors.
Extended Data Fig. 10
Extended Data Fig. 10. Neanderthal ancestry.
A) Detected archaic ancestry fragments in Takarkori and Taforalt inferred by admixfrog. Dark and light blue regions are homozygous and heterozygous Neanderthal fragments, respectively. Grey fragments indicate African ancestry and bar height is proportional to the posterior probability of ancestry. B) The longest archaic fragment in Takarkori is on chromosome 1 compared to the reference panel. The y-axis refers to the frequency of the alternative allele in the reference population (Africans or Neanderthals in this case) at the given position, and the x-axis stands for the SNP positions.

Similar articles

  • Pleistocene North African genomes link Near Eastern and sub-Saharan African human populations.
    van de Loosdrecht M, Bouzouggar A, Humphrey L, Posth C, Barton N, Aximu-Petri A, Nickel B, Nagel S, Talbi EH, El Hajraoui MA, Amzazi S, Hublin JJ, Pääbo S, Schiffels S, Meyer M, Haak W, Jeong C, Krause J. van de Loosdrecht M, et al. Science. 2018 May 4;360(6388):548-552. doi: 10.1126/science.aar8380. Epub 2018 Mar 15. Science. 2018. PMID: 29545507
  • Ancient DNA and deep population structure in sub-Saharan African foragers.
    Lipson M, Sawchuk EA, Thompson JC, Oppenheimer J, Tryon CA, Ranhorn KL, de Luna KM, Sirak KA, Olalde I, Ambrose SH, Arthur JW, Arthur KJW, Ayodo G, Bertacchi A, Cerezo-Román JI, Culleton BJ, Curtis MC, Davis J, Gidna AO, Hanson A, Kaliba P, Katongo M, Kwekason A, Laird MF, Lewis J, Mabulla AZP, Mapemba F, Morris A, Mudenda G, Mwafulirwa R, Mwangomba D, Ndiema E, Ogola C, Schilt F, Willoughby PR, Wright DK, Zipkin A, Pinhasi R, Kennett DJ, Manthi FK, Rohland N, Patterson N, Reich D, Prendergast ME. Lipson M, et al. Nature. 2022 Mar;603(7900):290-296. doi: 10.1038/s41586-022-04430-9. Epub 2022 Feb 23. Nature. 2022. PMID: 35197631 Free PMC article.
  • Genomic ancestry of North Africans supports back-to-Africa migrations.
    Henn BM, Botigué LR, Gravel S, Wang W, Brisbin A, Byrnes JK, Fadhlaoui-Zid K, Zalloua PA, Moreno-Estrada A, Bertranpetit J, Bustamante CD, Comas D. Henn BM, et al. PLoS Genet. 2012 Jan;8(1):e1002397. doi: 10.1371/journal.pgen.1002397. Epub 2012 Jan 12. PLoS Genet. 2012. PMID: 22253600 Free PMC article.
  • African human mtDNA phylogeography at-a-glance.
    Rosa A, Brehem A. Rosa A, et al. J Anthropol Sci. 2011;89:25-58. doi: 10.4436/jass.89006. Epub 2011 Mar 15. J Anthropol Sci. 2011. PMID: 21368343 Review.
  • Population history of North Africa based on modern and ancient genomes.
    Lucas-Sánchez M, Serradell JM, Comas D. Lucas-Sánchez M, et al. Hum Mol Genet. 2021 Apr 26;30(R1):R17-R23. doi: 10.1093/hmg/ddaa261. Hum Mol Genet. 2021. PMID: 33284971 Review.

Cited by

  • The origin of modern North Africans as depicted by a massive survey of mitogenomes.
    Colombo G, Moroni E, Raveane A, Rambaldi Migliore N, Agostini V, Di Gerlando R, Fiorini C, Caporali L, Gandini F, Raimondi E, D'Atanasio E, Lancioni H, Carelli V, Pala M, Trombetta B, Novelletto A, Dugoujon JM, Achilli A, Torroni A, Richards MB, Cruciani F, Semino O, Olivieri A. Colombo G, et al. Sci Rep. 2025 Jul 25;15(1):27025. doi: 10.1038/s41598-025-12209-x. Sci Rep. 2025. PMID: 40707575 Free PMC article.

References

    1. Kuper, R. & Kröpelin, S. Climate-controlled Holocene occupation in the Sahara: motor of Africa’s evolution. Science313, 803–807 (2006). - PubMed
    1. van de Loosdrecht, M. et al. Pleistocene North African genomes link Near Eastern and sub-Saharan African human populations. Science360, 548–552 (2018). - PubMed
    1. COHMAP Members. Climatic changes of the last 18,000 years: observations and model simulations. Science241, 1043–1052 (1988). - PubMed
    1. Ritchie, J. C., Eyles, C. H. & Haynes, C. V. Sediment and pollen evidence for an early to mid-Holocene humid period in the eastern Sahara. Nature314, 352–355 (1985).
    1. Tierney, J. E., Pausata, F. S. R. & deMenocal, P. B. Rainfall regimes of the Green Sahara. Sci. Adv.3, e1601503 (2017). - PMC - PubMed

LinkOut - more resources