. 2025 May;641(8062):512-519.
doi: 10.1038/s41586-025-08753-1. Epub 2025 Apr 2.

The RAD52 double-ring remodels replication forks restricting fork reversal

Affiliations

The RAD52 double-ring remodels replication forks restricting fork reversal

Masayoshi Honda et al. Nature. 2025 May.

Abstract

Human RAD52 is a multifunctional DNA repair protein involved in several cellular events that support genome stability, including protection of stalled DNA replication forks from excessive degradation1-4. In its gatekeeper role, RAD52 binds to and stabilizes stalled replication forks during replication stress, protecting them from reversal by SMARCAL1 motor3. The structural and molecular mechanism of the RAD52-mediated fork protection remains elusive. Here, using P1 nuclease sensitivity, biochemical and single-molecule analyses, we show that RAD52 dynamically remodels replication forks through its strand exchange activity. The presence of the single-stranded DNA binding protein RPA at the fork modulates the kinetics of the strand exchange without impeding the reaction outcome. Mass photometry and single-particle cryo-electron microscopy show that the replication fork promotes a unique nucleoprotein structure containing head-to-head arrangement of two undecameric RAD52 rings with an extended positively charged surface that accommodates all three arms of the replication fork. We propose that the formation and continuity of this surface is important for the strand exchange reaction and for competition with SMARCAL1.


Conflict of interest statement

Competing interests: The authors declare no competing interests.

Figures
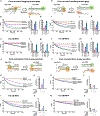
Extended Figure 1:
Extended Figure 1:. The outer DNA binding site of RAD52 is more critical for fork protection that the inner binding site.
a. Experimental design of the FRET-based fork reversal experiment. Synthetic DNA structure mimicking stalled fork with a lagging strand gap was assembled from oligonucleotides #1, #2, #14 and #15 listed in Supplemental Table 1 and schematically depicted in Supplemental Figure 1 (manifold 2). The Cy3 (FRET donor) and Cy5 (FRET acceptor) are incorporated into the parental and nascent strands of the leading strand arm, respectively. Their proximity yields high FRET signal (~0.7). SMARCAL1-mediated fork reversal separates the two labeled oligonucleotides resulting in decrease in FRET to ~0.2. b. Representative time courses of the fork (5 nM) reversal by 0.5 nM SMARCAL1 in the absence (black) or presence of the wild type RAD52 (orange; 165 nM), RAD52IBD mutant (purple; 165 nM) or RAD52OBD mutant (teal; 165 nM). c&d. Quantification of rate (c) and extent (d) of the fork reversal reaction. Bar graphs represent the average and standard deviation for three independent experiments. E-g are the same as b-d, but in the presence of 10 nM RPA. h-n are the same as a-g, except for the fork containing the leading strand gap assembled from oligonucleotides #1, #2, #12 and #13. o. Experimental design of the FRET-based fork restoration experiment. Synthetic DNA structure mimicking four-way junction produced by the RAD52 activity on stalled fork with a leading strand gap was assembled from oligonucleotides #16–19 listed in Supplemental Table 1 and schematically depicted in Supplemental Figure 1 (manifold 3). The design of the substrates for fork restoration experiments was based on the Betous et al. paper. Note that this substrate only allows fork remodeling in the restoration direction. The Cy3 (FRET donor) and Cy5 (FRET acceptor) are incorporated into the parental strands. Their proximity yields a high FRET signal (~0.7). SMARCAL1-mediated fork restoration separates the two labeled oligos resulting in decrease in FRET to ~0.2. p. Representative time courses of the fork (5 nM) reversal by 0.5 nM SMARCAL1 in the absence (black) or presence of the wild type RAD52 (orange; 165 nM), RAD52IBD mutant (purple; 165 nM) or RAD52OBD mutant (teal; 165 nM). r is the same as p, but in the presence of 10 nM RPA. q&s. Quantification of the rate of the fork restoration reactions. Bar graphs represent the average and standard deviation for three independent experiments. t-x are the same as o-s, but for the substrate that can proceed towards either restoration or reversal (assembled from oligonucleotides #20–23 listed in Supplemental Table 1 and schematically depicted in Supplemental Figure 1 (manifold 4). The placement of labels in this substrate allows to specifically monitor fork reversal. All data are plotted and analyzed in GraphPad Prism.
Extended Figure 2:
Extended Figure 2:. Mass photometry (MP) analysis of the RAD52-fork interaction. a-e. Mutations in the DNA binding sites of RAD52 affect the formation of the double-ring RAD52-fork complex.
a. Location of the inner DNA binding site (K152/R153; purple) and the bipartite outer DNA binding site (K102/K133/K169/R173) in one of the monomers (teal ribbon representation) in an undecamerc RAD52 ring. The mutations are mapped on the crystal structure of the RAD52-ssDNA complex (PDB: 5XRZ). Cartoon on the right shows position of the two binding site within the double-ring RAD52 structure. b-e. MP analysis of the macromolecular complexes formed by the mutant forms of RAD52. In all experiments, representative distributions are shown for 100 nM (11xFork; light blue), 220 nM (22xFork; medium blue), and 330 nM (33xFork; dark blue) RAD52IBD or RAD52OBD. Lines correspond to fitting of the molecular weights distributions with multiple Gaussians using GrapPad Prism. Vertical dotted lines indicate molecular weights of the RAD52 monomer, decamer and undecamer, respectively. Quantification of the peaks performed in the DiscoverMP software is detailed in the Supplemental Table 2. A heterologous DNA fork with a 30 nt lagging strand gap was assembled using oligonucleotides #2, #3, #4 and #6 listed in the Extended Data Table 1. b. Molecular weight distribution of the RAD52IBD in solution. Note that the RAD52IBD forms lower molecular weight complexes than the wild type RAD52. c. Molecular weight distributions of the RAD52IBD bound to heterologous fork. While binding to the fork is evident from the decrease in the peak corresponding for free fork and a shift of the peak corresponding to the RAD52IBD single ring, the amounts of double-ring complexes are lower compared to the wild type RAD52. d. Molecular weight distribution of the RAD52OBD in solution. e. Molecular weight distributions of the RAD52OBD bound to heterologous fork. Virtually no double rings are observed with this mutant. The shift in the single ring peak relative to the free RAD52OBD suggests binding to the fork. f-i. RAD52 forms double-undecamer structures on the model fork bound by RPA. f. The MP analysis of the 10 nM DNA fork (grey; the heterologous fork with a 30 nt lagging strand gap), 10 nM RPA (light green) and the fork-RPA complex (dark green). G. The MP analysis of RAD52. H. RAD52 + plus 10 nM fork. i. Fork DNA bound by RPA and RAD52. In all experiments, representative distributions are shown for 100 nM (11xFork; light blue), 220 nM (22xFork; medium blue), and 330 nM (33xFork; dark blue) RAD52. The RAD52-fork-RPA complexes are marked with * in i. See Supplemental Table 3 for quantification. j. Mass photometry experiment showing oligomeric states of 110, 220 and 330 nM RAD52 (from light to dark blue) bound four-way DNA junction substrate. Numbers above each peak indicate the number of RAD52 undecamers in each nucleoprotein complex.
Extended Figure 3:
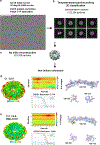
Extended Figure 3:. Workflow for obtaining the cryo-EM structure of the RAD52 undecamer.
a. Two data sets, 30° tilted and non-tilted, were collected for apo RAD52. b-c. For single particle analysis, micrographs were manually curated and multiple rounds of 2D classification were performed yielding a final stack of 623,559 particles which were used for ab-initio 3D reconstruction (d.). e. The final structures of apo RAD52 were obtained by performing a non-uniform refinement by imposing C1 (2.8Å, left) and C11 (2.5Å, right; EMD-41357) symmetries. The residues in the structures are colored by resolution suggesting the rigid core and DNA binding regions (blue) and more flexible loops (red). The three regions containing the DNA binding residues are shown as zoom-ins. The heatmaps of the angular distribution of particles used to generate the final structures of apo RAD52 are shown.
Extended Figure 4:
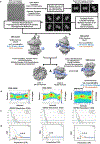
Extended Figure 4:. Workflow for obtaining the cryo-EM structures of the RAD52 double undecamer bound to synthetic fork DNA.
a. For single particle analysis, micrographs were manually curated and multiple rounds of 2D classification performed yielding a final stack of 63,576 particles of 2D classes containing RAD52 double rings. The selected 2D class averages were used as templates followed by multiple rounds of 2D classification yielding 124,131 particles prior to ab-initio reconstruction, heterogeneous refinement (4 classes) and homogeneous refinement of final structures of RAD52-fork DNA. The heatmaps of the angular distribution of particles used to generate the final RAD52-fork DNA structures (EMD-42066 and EMD-42069) are shown. The templates were then created from final maps and used for template picking and particle extraction from micrographs (1,945,503 particles) followed by multiple rounds of 2D classification and heterogeneous refinement. The final double-ring structure of EMD-42440 was obtained by performing non-uniform refinement, 2D classification, ab-initio reconstruction, and homogeneous refinement. b-d. The heatmaps and resolution evaluation for the RAD52-fork structures. b. The heatmap of the angular distribution of particles used to generate the final RAD52-fork DNA structures are shown. c. GSFSC curves from cryoSPARC are shown for the final RAD52-fork DNA structures. d. FSC curves with and without mask were calculated using Mtriage as part of Phenix package.
Extended Figure 5:
Extended Figure 5:. Atomistic model of the RAD52-DNA complex.
a. The cryo-EM density map of EMD-42069 was used for placement of the two undecameric RAD52 rings from the apo structure (PDB 8TKQ). The resulting structure was refined using YASARA knowledge-based force field and a simulated annealing molecular dynamics (MD) protocol. Duplex DNA corresponding to the 50 bp lagging strand arm was placed into the EM density to orient the fork. b. The observe EM density corresponds exactly to the length of the lagging strand arm (uninterrupted 50 bp duplex) and shows an additional density an angle consistent with the splitting of the fork from the parental duplex two daughter arms. These features allowed us to orient the DNA, but presented two possible configurations of the fork with respect to the spool-like RAD52 double ring. One configuration (left) positions both arms of the fork on the same side of the protein barrel, while the second configuration splits the fork positioning the leading and lagging strand arms on the opposite side of the spool. c. Models developed by a round of accelerated MD where the lagging strand arm and the protein were fixed (see methods). d. Zoom into the fork-protein interaction. In both models, interaction with the RAD52 double-ring distorts the dsDNA and ssDNA regions of the fork which make extensive interactions with the outer DNA binding site (residues highlighted in teal). The models represent an initial encounter complex in which the ssDNA gap starts venturing towards the ssDNA binding grove (purple). UCSF ChimeraX was used for data presentation.
Extended Figure 6:
Extended Figure 6:. RPA constrains the dynamics of the RAD52-mediated DNA strand exchange at the fork but does not reduce its efficiency.
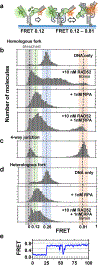
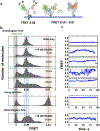
a. Cartoon depiction of the experimental design. A model replication fork with a leading strand gap was assembled from oligonucleotides #2, #7, #8 and #9 (homologous fork), #2, #7, #9 and #10 (four-way junction), or #2, #8, #9 and #11 (heterologous fork) listed in Supplemental Table 1. The Cy3 (FRET donor) and Cy5 (FRET acceptor) dyes are placed at the lagging and leading arms of the fork (FRET 0.26). b-d. Single-molecule FRET distributions for the forks containing two fully homologous arms (homologous fork) (b), fully exchanged fork (4-way junction) (c), and heterologous fork (the ssDNA gap region consists of 30 Ts) (d). Note that the peak around 0 FRET corresponds to the molecules with bleached Cy5 dye which accumulate over time. e. A representative smFRET trajectory for the RAD52-mediated strand exchange reaction in the presence of RPA.
Extended Figure 7:
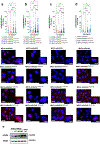
Extended Figure 7:. Competition between RAD52 and SMARCAL1 is observed at different time points after induction of replication stress and at different HU concentrations.
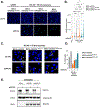
Analysis of SMARCAL1-parental ssDNA interaction by PLA. RAD52 knockdown cells, complemented with the indicated RAD52 mutants were treated with 100 μM IdU for 20 hours, released for 2 hours in fresh medium and exposed to HU at different time-points (a, c, d) or at low HU dose (b). Note that panel a. is the same fork:SMARCAL1 experiment as shown in Fig. 4g. – j. and is duplicated here for comparison with similar experiments carried out under different conditions. The PLA reaction was carried out using antibodies against the SMARCAL1 protein and IdU. Representative images are shown. Magnification of one nucleus is presented in the inset. (scale bar 20μm in inset). Graphs report the quantification of the number of PLA spot per nucleus in each condition represented by a different form of RAD52 (ns = not significant; **P<0.1; ***P < 0.001; ****P < 0.0001; Kruskal-Wallis test). e. WB showing the similar expression of each RAD52 isoform in the PLA experiments.
Extended Figure 8:
Extended Figure 8:. Competition between RAD52 and SMARCAL1 is observed also in a BRCA2-mutated background.
Analysis of SMARCAL1-parental ssDNA interaction by PLA. The BRCA2-mutated cancer cell line PEO1 and its spontaneous revertant, BRCA2-proficient, clone PEO4 were treated with 100 μM IdU for 20 hours, released for 2 hours in fresh medium and exposed to HU. The PLA reaction was carried out using antibodies against the SMARCAL1 protein and IdU. DNA was visualized with DAPI staining a. Representative images are shown. Scale bar is 100μm and 40μm in insets. b. Experimental scheme of the assay. c. Quantification of the number of PLA spot per nucleus (ns = not significant; **P<0.1; ***P < 0.001; ****P < 0.0001; Kruskal-Wallis test).
Extended Figure 9:
Extended Figure 9:. Analysis of the DNA damage and genome instability.
MRC5 RAD52 knockdown cells, complemented with the indicated RAD52 mutants were transfected with control RNAi (siCTRL) or siRNA direct against BRCA2. Forty-eight hours after transfections cells were treated as indicated. a. Representative immunofluorescence images of the cells stained for γ-H2AX (DNA damage; green). Nuclei were visualized by staining with DAPI. b. Graph shows the intensity of γ-H2AX staining for single nuclei. Quantification was carried out using the ImageJ software and the data were plotted using GraphPad Prism. Values are presented as means ± SE (ns = not significant; ****P < 0.0001 Kruskall-Wallis test; N = 339). c. Zoom-in on the induvial nuclei. White arrows indicate the presence of micronuclei. d. Graph shows the percentage of micronuclei for least of 300 nuclei analysed for each condition. e. Western blot confirming depletion of BRCA2 and/or RAD52, and expression of ectopic, RNAi-res, RAD52 isoforms.
Figure 1.
Figure 1.. RAD52 mediates DNA strand exchange reaction at replication fork.
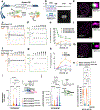
a. DNA forks were prepared as described in the Supplemental Fig. 1b (manifold 1). The anticipated product is shown on the right. b. Domain organization of the RAD52 monomer and the side view of the RAD52 undecameric ring (carton and a representative cryo-EM 2D class average). c. A PAGE gel showing products of the P1 digestion of the Cy5-labeled strand. Asterisk marks the product dependent on the strand exchange. d. The same as c, but for the Cy3-labeled strand. e. Quantification of the unique Cy5 (orange) and Cy3 (green) bands is shown as average and standard deviation for three independent experiments. f. and g. are the same as c and d., but for the heterologous fork. h. Quantification of the strand exchange product for the reactions containing wild type RAD52 (orange), RAD52IBD (purple) and RAD52OBD (teal). i. PLA analysis. The graph reports the number of PLA spot per nucleus (ns = not significant; ****P < 0.0001; Kruskal-Wallis test.). See Supplemental Fig. 2 for representative images and Western blot. j. Immunofluorescence analysis of the ssDNA exposure upon replication fork reversal and degradation. The ssDNA was detected by native anti-IdU immunofluorescence. Graph shows the intensity of ssDNA staining (AU) per cell from two replicates (****P < 0.0001; Kruskal-Wallis test). See Supplemental Fig. 2 for representative images. l. – n. Representative images from nuclei treated with 4h HU and showing clusters of EdU and EdU-RAD52 detected by dSTORM in cells expressing wild-type RAD52 (l), RAD52OBD (m) or treated with EGC (n). The mixed colors denote binary signals. o. Quantification of EdU-RAD52 localization by dSTORM. The graph shows % of EdU-RAD52 co-localization events from 20 images. All the values are means ± SD. (****P < 0.0001; *** p < 0.001 Mann-Witney test).
Figure 2.
Figure 2.. RAD52 is organized on the DNA replication fork into a unique two-ring structure.
The fork was assembled as shown in Supplemental Fig. 1 and Supplemental Table 1. a. Mass photometry experiment showing oligomeric states of 110, 220 and 330 nM RAD52 (from light to dark blue) and DNA fork (grey) (see Supplemental Table 2 for quantification). b. Representative 2D classes from the cryo-EM analysis of the apo RAD52 ring depicting the top and side views. The cartoon representation shows the location of the inner (purple) and outer (teal) DNA binding sites (see Extended Data Fig. 3 for the 2.5 Å resolution structure and cryo-EM data collection and processing workflow). C. Mass photometry experiment showing oligomeric states of 110, 220 and 330 nM RAD52 (from light to dark blue) bound to the fork DNA (see Supplemental Table 2 for quantification). d. Representative 2D classes from the cryo-EM analysis of the RAD52-fork complex showing a side view with the DNA visible (marked by arrows) and another side view with two rings slightly off register. See Extended Data Fig. 4 for the structures and cryo-EM workflow. E. A cryo-EM structure of the RAD52-fork DNA complex. The RAD52 double undecamer is shown in grey and the fork DNA is in blue (see Extended Data Fig. 4 and Extended Data Table 1 for the additional structures, and cryo-EM data collection and processing workflow).
Figure 3.
Figure 3.. Single-molecule FRET analysis of the RAD52-mediated strand exchange reaction on the model replication fork.
a. Cartoon depicting experimental design. A model replication fork with a leading strand gap was assembled as shown in Supplemental Fig. 1). The Cy3 (FRET donor) and Cy5 (FRET acceptor) dyes are placed at the lagging and leading arms of the fork (FRET 0.26). Complete strand exchange reaction confined to the gap region yields a 4-way junction and a characteristic FRET 0.81). b. Single-molecule FRET distributions for the forks containing two fully homologous arms (homologous fork), fully exchanged fork (4-way junction), and heterologous fork. The peak around 0 FRET corresponds to the molecules with bleached Cy5 dye which accumulate over time. c. Representative smFRET trajectories (time-based changes in the FRET signal from individual fork molecules) for each condition in b.
Figure 4.
Figure 4.. Competition between RAD52 and SMARCAL1 for binding to replication fork depends on the integrity of the outer DNA binding site.
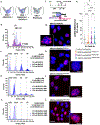
a. Cartoon depicting the molecular species expected in the mass photometry (MP) experiment. b. The MP of the Fork DNA alone (grey), SMARCAL1 (alone) and the SMARCAL1:fork complex (purple). b. – e. Representative MP data for the complexes formed by RAD52, fork and SMARCAL1: (1) fork or SMARCAL1 alone; (2) SMARCAL1-fork complex; (3) one ring of RAD52+fork; (4) one ring of RAD52+fork+SMARCAL1; (5) two rings of RAD52+fork; (6) three rings of RAD52+fork. Quantification of the MP data is summarized in the Extended Data Figure 5. f. Schematic of the SMARCAL1-parental ssDNA interaction by PLA . RAD52 knockdown cells, complemented with the indicated RAD52 mutants were treated with 100 μM IdU for 20 hours, released for 2 hours in fresh medium and exposed to HU. The PLA reaction was carried out using antibodies against the SMARCAL1 protein and IdU. g. – j. Representative PLA images. Magnification of one nucleus is presented in the inset (scale bar 100μm and 20μm in inset). k. Quantification of the number of PLA spot per nucleus. (ns = not significant; **P<0.1; ***P < 0.001; ****P < 0.0001; Kruskal-Wallis test).

Update of

References

    1. Bhat DS, Spies MA & Spies M A moving target for drug discovery: Structure activity relationship and many genome (de)stabilizing functions of the RAD52 protein. DNA Repair 120, 103421 (2022). - PMC - PubMed
    1. Malacaria E, Honda M, Franchitto A, Spies M & Pichierri P Physiological and Pathological Roles of RAD52 at DNA Replication Forks. Cancers 12 (2020). - PMC - PubMed
    1. Malacaria E et al. Rad52 prevents excessive replication fork reversal and protects from nascent strand degradation. Nature communications 10, 1412 (2019). - PMC - PubMed
    1. Murfuni I et al. Survival of the replication checkpoint deficient cells requires MUS81-RAD52 function. PLoS Genet 9, e1003910 (2013). - PMC - PubMed
    1. Yeeles JT, Poli J, Marians KJ & Pasero P Rescuing stalled or damaged replication forks. Cold Spring Harbor perspectives in biology 5, a012815 (2013). - PMC - PubMed

MeSH terms

LinkOut - more resources