. 2025 May;641(8062):456-464.
doi: 10.1038/s41586-025-08796-4. Epub 2025 Apr 2.

Bifidobacteria support optimal infant vaccine responses

Affiliations

Bifidobacteria support optimal infant vaccine responses

Feargal J Ryan et al. Nature. 2025 May.

Abstract

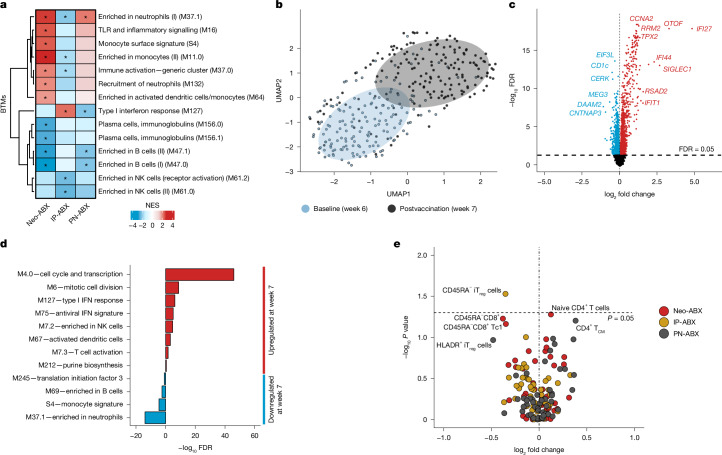
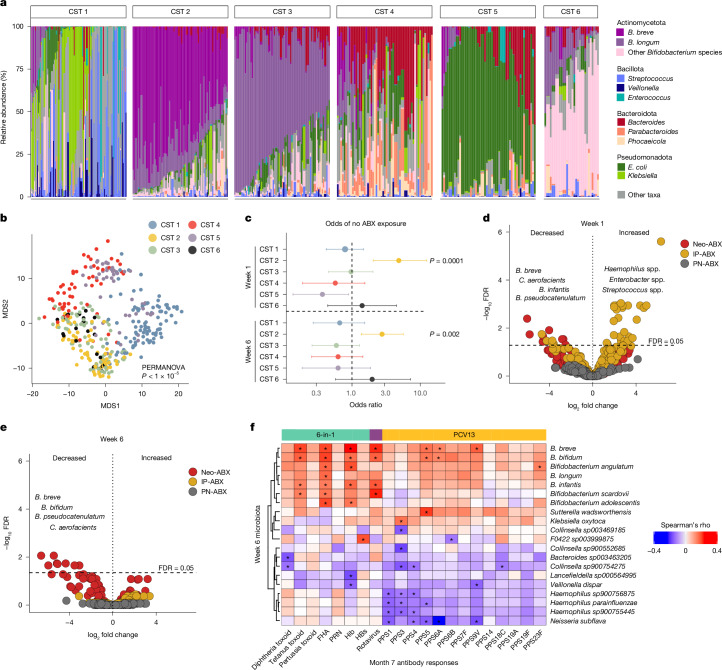
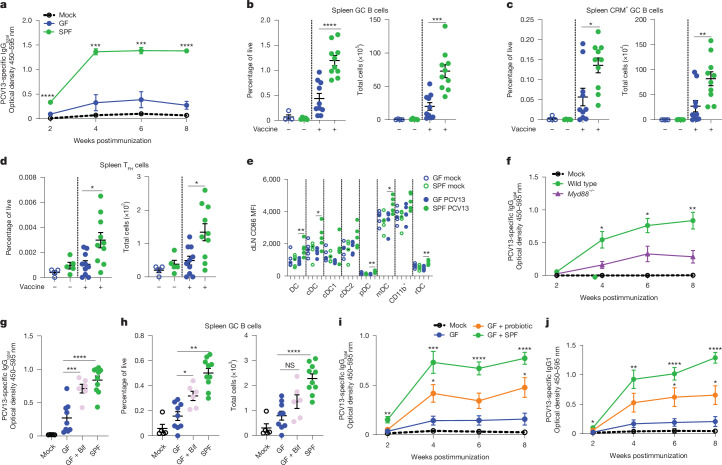
Accumulating evidence indicates that antibiotic exposure may lead to impaired vaccine responses1-4; however, the mechanisms underlying this association remain poorly understood. Here we prospectively followed 191 healthy, vaginally born, term infants from birth to 15 months, using a systems vaccinology approach to assess the effects of antibiotic exposure on immune responses to vaccination. Exposure to direct neonatal but not intrapartum antibiotics was associated with significantly lower antibody titres against various polysaccharides in the 13-valent pneumococcal conjugate vaccine and the Haemophilus influenzae type b polyribosylribitol phosphate and diphtheria toxoid antigens in the combined 6-in-1 Infanrix Hexa vaccine at 7 months of age. Blood from infants exposed to neonatal antibiotics had an inflammatory transcriptional profile before vaccination; in addition, faecal metagenomics showed reduced abundance of Bifidobacterium species in these infants at the time of vaccination, which was correlated with reduced vaccine antibody titres 6 months later. In preclinical models, responses to the 13-valent pneumococcal conjugate vaccine were strongly dependent on an intact microbiota but could be restored in germ-free mice by administering a consortium of Bifidobacterium species or a probiotic already widely used in neonatal units. Our data suggest that microbiota-targeted interventions could mitigate the detrimental effects of early-life antibiotics on vaccine immunogenicity.


Conflict of interest statement

Competing interests: D.J.L., S.J.B., F.J.R. and M.A.L. have received funding from GSK related to this area of research. D.J.L. and H.S.M. are consultants for GPN Vaccines (Australia). H.S.M. is an investigator on sponsored vaccine trials funded by Iliad and Pfizer. H.S.M. has received institutional funding for investigator-led studies from Pfizer, Sanofi-Aventis and Seqiris. P.R. has received institutional funding for investigator-led grants from Merck and Sanofi outside this work. His institution receives funding for his participation in vaccine scientific advisory boards from Pfizer, Merck, GSK, GPN Vaccines (Australia) and Sanofi-Aventis unrelated to this work. He is an investigator on sponsored vaccine trials funded by Iliad, GSK, Merck, Sanofi, Dynavax and Pfizer. He is coinventor on a patent for a new bacteriotherapy for treating or preventing respiratory infection unrelated to this work. The other authors declare no competing interests.

Figures

Fig. 1
Fig. 1. Vaccine-specific antibody responses are frequently impaired in infants directly exposed to antibiotics in the neonatal period.
a, Overview of the AIR study design. Responses to the polio, measles, mumps, rubella and meningococcal ACWY vaccines were not measured in this study. b, Antibiotics administered to infants and their mothers in the direct neonatal antibiotic exposure group (Neo-ABX, n = 32 infants), intrapartum antibiotic exposure group (IP-ABX, n = 49 infants) and postnatal antibiotic exposure group (PN-ABX, n = 30 infants). c, Heatmap showing fold change in the geometric mean concentration (GMC) of vaccine antigen-specific antibodies in serum collected from Neo-ABX (n = 27 at 7 months, n = 26 at 15 months), IP-ABX (n = 43 at 7 months, n = 42 at 15 months) and PN-ABX (n = 26 at 7 months, n = 27 at 15 months) infants, relative to No-ABX infants (n = 64 at 7 months, n = 65 at 15 months). The blue–red gradient indicates decreased and increased fold change, respectively. Statistical significance in c was assessed using a generalized linear model adjusting for sex and baseline antibody titres. *P < 0.05 (unadjusted). All statistical tests were two-sided. Exact P values are provided in Supplementary Table 3a. Icons in a were created using BioRender (https://biorender.com). DTP, diphtheria, tetanus and pertussis; Hep., hepatitis. Source data
Fig. 2
Fig. 2. Antibiotic exposure in early life is associated with impaired antibody functionality and lower seroprotective responses against some vaccine antigens.
ac, Opsonophagocytic activity of serum collected from Neo-ABX (n = 26) and No-ABX (n = 59) infants at 7 months against PPS6B (a), PPS9V (b) and PPS18C (c). d,e, Proportions of No-ABX (n = 55) and Any-ABX (n = 83) infants achieving a seroprotective response against each vaccine antigen at 7 (d) and 15 (e) months. f, Proportions of No-ABX (n = 55), Neo-ABX (n = 22), IP-ABX (n = 38) and PN-ABX (n= 23) infants achieving a seroprotective response against each vaccine antigen at 15 months. g, Serum bactericidal activity against N. meningitidis NZ98/254 at week 7 (prevaccination, n= 140) and at 7 (n = 139) and 15 (n= 138) months. h, Serum bactericidal activity geometric mean titres (GMTs) subdivided by no or any antibiotic exposure at 7 months (No-ABX, n= 57; Any-ABX, n = 82). i, Serum bactericidal activity GMTs at 7 months subdivided by the indicated antibiotic exposure groups (No-ABX, n = 57; Neo-ABX, n = 22; IP-ABX, n = 37; PN-ABX, n = 23). j, Serum bactericidal activity GMTs subdivided by no or any antibiotic exposure at 15 months (No-ABX, n = 56; Any-ABX, n = 82). n represents the sample size of infants in each case. For the box plots in ac and gj, the box denotes the 25th and 75th percentiles, the whiskers the 5th and 95th percentiles, and the middle bar the median. Bar charts in df represent data as percentages. Statistical significance was assessed in ac and gj using a generalized linear model (Gaussian distribution) and in df using logistic regression, adjusting for sex. *P < 0.05, ***P < 0.001 (unadjusted). All statistical tests were two-sided. Exact P values are provided in the source data. Source data
Fig. 3
Fig. 3. Antibiotic-exposed infants have altered blood transcriptional profiles pre- and postvaccination.
a, Heatmap showing normalized enrichment scores (NES) for selected BTMs before vaccination in Neo-ABX (n = 24), IP-ABX (n= 44) and PN-ABX (n = 25) infants compared with No-ABX infants (n= 66). n represents the number of infants in each group prevaccination when RNA sequencing was performed. The blue–red gradient indicates decreased and increased BTM activity, respectively, relative to that of No-ABX infants. b, UMAP projection of whole-blood gene expression data pre- and postvaccination (n = 329 infant blood samples), adjusted for sex and batch using SVAseq. c, Volcano plot of differentially expressed genes postvaccination. d, Selected BTMs that were statistically enriched among differentially expressed genes. e, Volcano plot showing fold change in circulating immune cell populations in Neo-ABX (n = 27), IP-ABX (n = 40) and PN-ABX (n = 26) infants relative to No-ABX (n = 63) infants. Statistical significance was assessed using the fgsea R package in a and d and using the edgeR package in c. The Benjamini–Hochberg method was used to adjust for multiple comparisons in a, c and d, with an FDR < 0.05 considered to indicate statistical significance. Statistical significance in e was assessed using two-tailed Wilcoxon signed-rank tests without adjustment for multiple comparisons. Asterisk indicates FDR < 0.05. Exact P values can be found in the supplementary tables or source data. NK, natural killer; TCM, central memory T cell; Treg, regulatory T cell. Source data
Fig. 4
Fig. 4. Depletion of Bifidobacterium species at the time of first-dose immunization is associated with impaired antibody responses to vaccination.
a, Taxonomic composition of stool samples (n = 409) collected from study infants, as determined by shotgun metagenomics sequencing. Samples are grouped by CST. b, Multidimensional scaling (MDS) analysis of the six CSTs. c, Odds ratios of a sample (n = 396) in each CST at week 1 and week 6 of life being from an infant not exposed to antibiotics. d,e, Volcano plots showing fold change in the CLR abundance of taxa in the faecal microbiota of Neo-ABX, IP-ABX and PN-ABX infants, relative to No-ABX infants, at week 1 (No-ABX, n = 79; Neo-ABX, n = 36; IP-ABX, n = 55; PN-ABX n = 33) (d) and week 6 (No-ABX, n = 80; Neo-ABX, n = 33; IP-ABX, n = 49; PN-ABX, n = 31) (e). n represents the number of infants. f, Heatmap representing correlations between the CLR abundance of the top ten most positively correlated and top ten most negatively correlated taxa in the infant faecal microbiota at week 6 and antibody responses to vaccination (adjusted for sex and baseline titres) at month 7. The blue–red gradient represents negative and positive Spearman correlations, respectively (n = 139 with matched data across the three time points). See Supplementary Table 13 for exact correlation coefficients. Error bars in c indicate 95% confidence intervals. Statistical significance was assessed using permutational multivariate analysis of variance in b, Fisher’s exact test in c, the LinDA method in the MicrobiomeState R package in d and e, and the cor.test R function in f. All statistical tests were two-sided. The Benjamini–Hochberg method was used to adjust for multiple comparisons in d and e, with FDR < 0.05 considered to indicate statistical significance. *P < 0.05 (unadjusted). Exact FDR values for d and e can be found in Supplementary Table 11. Source data
Fig. 5
Fig. 5. Immune responses to PCV13 in mice strongly depend on the gut microbiota and signalling through a MyD88-dependent pathway.
a, PCV13-specific IgGtotal in sera from GF (n = 9) and SPF (n = 10) mice vaccinated with two doses of PCV13. Mock, PBS-vaccinated mice (n = 3). bd, Frequencies and total numbers of total GC B cells (b) or CRM197+ GC B cells (c) in the spleens of mock-vaccinated mice (n = 9) and PCV13-vaccinated GF (n = 10) and SPF (n = 10) mice at 2 weeks postboost; and frequencies and total numbers of TFH cells (d) in the spleens of these mice. e, CD86 mean fluorescence intensity (MFI) on indicated myeloid cell populations in the dLN of GF and SPF mice 24 h following PCV13 or mock vaccination (n = 5 mice per group). f, PCV13-specific IgGtotal antibodies in the serum of mock-vaccinated mice (n = 5) and PCV13-vaccinated Myd88−/− (n = 10) and littermate wild-type (n = 10) mice. g, PCV13-specific IgGtotal in the serum of mock-vaccinated mice (n = 5) and PCV13-vaccinated (two doses intraperitoneally, 2 weeks apart) SPF (n = 10) and GF (n = 9) mice, and GF mice born to dams colonized with a consortium of Bifidobacterium species in pregnancy and administered these strains again at days 7 and 14 postbirth (GF + Bif, n = 6). Data shown are at 2 weeks postboost. h, Frequencies and total numbers of GC B cells in the spleens of mice from g at 2 weeks postboost. i,j, PCV13-specific IgGtotal (i) and IgG1 (j) in the sera of mock-vaccinated mice (n = 3), SPF mice (n = 8), GF mice (n = 8 mice), and GF mice colonized with probiotic strains L. acidophilus and B. bifidum at day 21 of life (GF + Probiotic, n = 7). Mice were vaccinated at day 28 of life. Data in aj represent the mean ± s.e.m. Data in ad are representative of three or more independent experiments; data in ej are representative of two independent experiments. Statistical significance was assessed in a, f, i and j using two-way analysis of variance with Tukey’s posttest analysis for multiple comparisons, in be using two-tailed Student’s t-tests, and in g and h using one-way analysis of variance with Dunnett’s posttest analysis for multiple comparisons. *P < 0.05; **P < 0.01; ***P < 0.001; ****P < 0.001; NS, not significant. Exact P values are provided in the source data. Source data
Extended Data Fig. 1
Extended Data Fig. 1. Study cohort flow diagram.
Flow of participant recruitment and progress through the Antibiotics and Immune Responses (AIR) study.
Extended Data Fig. 2
Extended Data Fig. 2. Antibody titres for each of the measured vaccine antigens at baseline and at 7 and 15 months.
(a-m) IgG titres against the 13 capsular pneumococcal polysaccharide serotypes (PPS) in the PCV13 vaccine in sera collected from infants at baseline, 7 months and 15 months (n = 139 infants per timepoint; only infants with matched samples across 3 timepoints included). (n-t) IgG titres against (n) tetanus toxoid (TT), (o) pertussis toxoid (PT), (p) diphtheria toxoid (DT), (q) Haemophilus influenzae type b (Hib) polyribosylribitol phosphate (PRP), (r) hepatitis B surface antigen (HBsAg), (s) pertactin (PRN), and (t) filamentous haemagglutinin (FHA) (all antigens in the 6-in-1 Infanrix Hexa® vaccine) in sera. (u) anti-rotavirus vaccine IgA titres in sera (n = 139). (v) Spearman correlations between baseline antibody titres and titres at 7 months (n = 139). Data in a-u are represented as boxplots with the box denoting the 25th and 75th percentiles, the whiskers the 5th and 95th percentiles, the middle bar is the median. Statistical significance was assessed in a-u using a generalised linear model adjusting for sex and baseline antibody titres. Data shown in v were determined using the cor.test function in R. * unadjusted P < 0.05, **P < 0.01, ***P < 0.001, ****P < 0.0001. Exact P values are provided in the Source Data File. All P values are two-sided. Source data
Extended Data Fig. 3
Extended Data Fig. 3. Antibody titres for each of the measured vaccine antigens at 7 months of life subdivided by antibiotic exposure group.
(a-f) IgG titres in sera at 7 months against 6 of the 13 capsular pneumococcal polysaccharides (PPS1, 6B, 9 V, 18 C, 19 F and 23 F) in the PCV13 vaccine that were significantly lower in Neo-ABX infants. (g-h) IgG titres against PPS4 and PPS5, which trended lower in Neo-ABX infants at 7 months. (i-m) IgG titres against other capsular pneumococcal polysaccharides that were not lower in Neo-ABX infants at 7 months. (n-t) IgG titres against (n) DT, (o) Hib-PRP, (p) TT, (q) PT, (r) HB sAG, (s) PRN and (t) FHA in sera collected from infants at 7 months. (u) anti-rotavirus vaccine IgA titres in sera collected from infants at 7 months. (a-u) No-ABX (n = 64 infants), Neo-ABX (n = 27 infants), IP-ABX (n = 43 infants), PN-ABX (n = 26 infants). Data in a-u are represented as boxplots with the box denoting the 25th and 75th percentiles, the whiskers the 5th and 95th percentiles, the middle bar is the median. Statistical significance was assessed in a-u using a generalised linear model (Gaussian distribution) adjusting for sex and baseline antibody titres. *unadjusted P < 0.05, ** P < 0.01. Exact P values are provided in the Source Data File. All P values are two-sided. Source data
Extended Data Fig. 4
Extended Data Fig. 4. Antibody titres for each of the measured antigens at 15 months of life subdivided by antibiotic exposure group.
(a-u) IgG titres in sera at 15 months against (a) PPS14, (b) PPS19A, (c) Hib-PRP, (d) PPS6A, (e) PPS9V, (f) PPS19F, (g) PPS23F (all significantly lower in Neo-ABX and/or PN-ABX infants), (h) PPS1, (i) PPS3, (j) PPS4, (k) PPS5, (l) PPS6B, (m) PPS7F, (n) PPS18C, (o) DT, (p) TT, (q) PT, (r) HB sAG, (s) PRN, (t) FHA. (u) anti-rotavirus vaccine IgA titres in sera collected from infants at 15 months. a-u No-ABX (n = 65 infants), Neo-ABX (n = 26 infants), IP-ABX (n = 42 infants), PN-ABX (n = 27 infants). Data in a-u are represented as boxplots with the box denoting the 25th and 75th percentiles, the whiskers the 5th and 95th percentiles, the middle bar is the median. Statistical significance was assessed in a-u using a generalised linear model adjusting for sex and baseline antibody titres. * unadjusted P < 0.05, **P < 0.01. Exact P values are provided in the Source Data File. All P values are two-sided. Source data
Extended Data Fig. 5
Extended Data Fig. 5. Whole-blood gene expression responses in antibiotic exposed and unexposed infants.
RNAseq analysis was performed on blood collected from infants at week 6 and 7 (n = 329 infant blood samples). (a) Heatmap representing the correlations (Spearman’s Rho) between the activity of selected Blood Transcriptional Modules (BTMs) at week 6 of life and antibody responses at 7 months of life (n = 139 infants). (b) UMAP projection of baseline (pre-vaccination) whole-blood gene expression data, adjusted for sex and batch using SVAseq. Data points coloured by infant age at sample collection (n = 159 infants). (c) Normalised expression of one of the DEGs identified post-vaccination, IFI27, showing that expression is not correlated with infant age (n = 159 infants). (d) Heatmap showing the normalised expression of type I interferon (IFN) response genes (annotated in BTM M127) pre- and post-vaccination (n = 329 infant blood samples). (e) Heatmap showing the Normalised Enrichment Scores (NES) in Neo-, IP- and PN-ABX infants for selected BTMs post-vaccination (week 7), relative to No-ABX infants (n = 147 infants). (f) Gene set enrichment analysis (GSEA) of selected BTMs comparing their expression in No-, Neo-, IP-, and PN-ABX infants at week 7 to No-ABX infants at week 6 (n = 294 samples). (g) Heatmap, as per panel e, showing the NES for selected BTMs post-vaccination in Neo-ABX (n = 27), IP-ABX (n = 44) and PN-ABX (n = 28) infants compared to No-ABX infants (n = 71). (h-o) Flow cytometry analysis was performed on fresh peripheral blood collected from No-ABX (n = 63 infants), Neo-ABX (n = 27 infants), IP-ABX (n = 40 infants), and PN-ABX (n = 26 infants) infants at week 7. Representative gates and counts/mL of blood for (h-i) CD45RA Tregs, (j-k) CD16CD14+ classical monocytes, (l-m) CD16+CD15+ neutrophils, and (n-o) CD19+ B cells. Data in i, k, m, o are represented as boxplots with the box denoting the 25th and 75th percentiles, the whiskers the 5th and 95th percentiles, the middle bar is the median. Statistical significance was assessed in a using the cor.test function in R, in e-g using the fgsea package in R and in i, k, m, o using two-tailed Wilcoxon signed-rank tests. *P < 0.05, ns = not significant. Exact FDR values in e and g can be found in Supplementary Tables 5 and 7. All P values are two-sided. Source data
Extended Data Fig. 6
Extended Data Fig. 6. Extended analyses of the gut microbiota at week 1 and 6 of life in infants recruited to the AIR study.
(a) Bacterial load (16S rRNA gene copies) in stool samples collected from No-, Neo-, IP-, and PN-ABX infants at week 1 (n = 205 infants) and 6 of life (n = 190 infants). (b) Shannon diversity (c) Chao1 richness. (d-e) The abundance of penicillin and aminoglycoside antimicrobial resistance genes (ARGs) in No-, Neo-, IP-, and PN-ABX infants at week 1 and 6 of life. RPKM = reads per kb per million mapped reads. (f) The proportion of No-, Neo-, IP-, and PN-ABX infants at week 1 and 6 of life among the six CSTs. (n = 396 stool samples in b-f). (g-l) The centered-log ratio (CLR) abundance of selected differentially abundant taxa, see Supplementary Table 11 for a complete list. (g-i n = 203, j-l n = 193 stool samples). Data in a-e, g-l are represented as boxplots with the box denoting the 25th and 75th percentiles, the whiskers the 5th and 95th percentiles, the middle bar is the median. Statistical significance was assessed in a-e using two-tailed Wilcoxon signed-rank tests and in g-l using the LinDA method in the MicrobiomeStat R package. All statistical tests were two-sided. * unadjusted P < 0.05, **P < 0.01, ***P < 0.001, ns = not significant. Exact P values are provided in the Source Data File. Source data
Extended Data Fig. 7
Extended Data Fig. 7. Additional analyses assessing the relationship between the composition of the gut microbiota and vaccine response.
(a) Heatmap representing the correlations between the normalised abundance of top 10 most positively correlated, and top 10 most negatively correlated taxa in the infant faecal microbiota at week 1 and antibody responses to vaccination (adjusted for sex and baseline titres) at month 7 (n = 134 infants with matched data across the 3 timepoints). Exact correlation coefficients are provided in Supplementary Table 13. (b) The centred log ratio (CLR) normalised abundance of the Bifidobacterium species that were most depleted in Neo-ABX infants at week 6 of life comparing high (75%ile, n = 40) vs. low (25%ile, n = 40) vaccine responders for each of the antigens assessed. Data in a are represented as a heatmap where the blue-red gradient represents negative and positive Spearman correlations, respectively. Data in b are represented as boxplots with the box denoting the 25th and 75th percentiles, the whiskers the 5th and 95th percentiles, the middle bar is the median. Statistical significance was assessed in a using the cor.test function in R and in b using the LinDA method in the MicrobiomeStat R package. All statistical tests were two-sided. * unadjusted P < 0.05. Source data
Extended Data Fig. 8
Extended Data Fig. 8. Germ-free mice have impaired serum antibody responses to the PCV13 and Infanrix Hexa vaccines, but not the 4CMenB meningococcal B vaccine.
(a) PCV13-specific IgG1, (b) IgG2c, (c) IgG3, (d) IgM antibodies were assessed by ELISA in serum collected from mock (PBS, n = 3 mice) and PCV13 vaccinated GF (n = 9 mice) and SPF (n = 10 mice) mice that were vaccinated at day 28 of life with two doses of PCV13 vaccine i.p., two weeks apart. IgGtotal responses against (e) PPS1, (f) PPS3, (g) PPS6B, (h) PPS9V were also assessed in these mice. (i) IgGtotal responses against CRM197 were assessed by ELISA in serum collected from mock (PBS, n = 3 mice) and PCV13 vaccinated GF (n = 8 mice) and SPF (n = 8 mice) mice. (j) Diphtheria toxoid, (k) tetanus toxoid, and (l) pertussis toxoid IgGtotal responses were assessed by ELISA in serum collected from mock vaccinated (n = 2 mice) mice and GF (n = 8 mice) and SPF (n = 8 mice) mice vaccinated i.p. with two doses of Infanrix Hexa vaccine at day 28 of life. (m) 4CMenB-specific IgGtotal responses were assessed by ELISA in serum collected from mock (n = 8 mice) vaccinated mice and GF (n = 7 mice) and SPF (n = 10 mice) mice vaccinated i.p. with 4CMenB (meningococcal B) vaccine at day 28 of life. The frequency (as % of live) and total number of (n-o) GC B cells, (p-q) CRM197+ GC B cells and (r-s) T follicular helper (Tfh) cells in the dLN of mock (n = 9 mice), GF (n = 10 mice) and SPF (n = 10 mice) mice at 2 weeks after the 2nd dose of PCV13 was administered. Data in a-s are represented as mean ± SEM. Data in a-i, n-s are representative of two independent experiments. Data in j-l and m are from two different single independent experiments. Statistical significance in a-m was assessed using two-way ANOVA with Tukey’s post-test analysis for multiple comparisons and in n-s using two-tailed Student’s t-tests. *P < 0.05, **P < 0.01, ***P < 0.001, ****P < 0.001, ns = not significant. Exact P values are provided in the Source Data File. Source data
Extended Data Fig. 9
Extended Data Fig. 9. Germ-free mice have impaired germinal centre formation following vaccination with the PCV13 vaccine.
Confocal microscopy of dLNs collected from mock (PBS) and PCV13 vaccinated GF and SPF mice that were vaccinated at day 28 of life with one 3 μg dose of PCV13 vaccine i.p. Data shown are at two weeks post-immunisation. CD3, CD21/35, GL7 and IgD staining are visualised separately and then merged. A white box has been placed around the GL7 staining, which visible only in the vaccinated SPF mice. Data are from a single experiment. The scale bar represents 100 μm.
Extended Data Fig. 10
Extended Data Fig. 10. Extended data on immune responses to PCV13 in germ-free, Myd88−/−, Tlr4−/− and Tlr2−/− mice.
(a) MHCII and (b) CD80 MFI on indicated myeloid cell populations in the dLN of GF and SPF mice 24 h following PCV13/mock vaccination (n = 5 mice per group). (c) CD86 MFI on indicated myeloid cell populations in the dLN of GF and GF mice colonised with B. breve from birth, 24 h following PCV13/mock vaccination (n = 3 mice per group). PCV13-specific (d) IgG1, (e) IgG2c, (f) IgM antibodies as assessed by ELISA in the serum of mock (n = 5 mice) and PCV13 vaccinated Myd88−/− (n = 10 mice) and littermate wildtype (WT, n = 10 mice) mice. PCV13-specific IgGtotal antibodies as assessed by ELISA in the serum of mock and PCV13 vaccinated (g) Tlr4−/− (n = 10 mice) and (h) Tlr2−/− (n = 11 mice) and littermate WT mice (n = 10, and 9, respectively). Mice in d-h were vaccinated at day 28 of life with two 3 μg doses of PCV13 vaccine i.p., two weeks apart. PCV13-specific (i) IgG1 and (j) IgM in the serum of mock vaccinated (n = 5 mice) and PCV13 vaccinated (two doses i.p., two weeks apart) SPF (n = 10 mice), GF (n = 9 mice), and GF mice born to dams colonised with a consortium of Bifidobacterium species in pregnancy and administered these strains again at day 7 and 14 post-birth (GF+Bif, n = 6 mice). Data shown are at 2 weeks post-boost. (k) The frequency (as % of live) and total number of GC B cells in the dLN of mice in (i) at 2 weeks post-boost. The frequency (as % of live) and total number of Tfh cells in the (l) spleen and (m) dLN of mice in (i) at 2 weeks post-boost. PCV13-specific (n) IgGtotal, (o) IgG1 and (p) IgM antibodies as assessed by ELISA in serum of mice in (i) collected two weeks after PBS (mock) or PCV13 vaccination (one 3 μg dose i.p.). PCV13-specific (q) IgGtotal and (r) IgG1 antibodies as assessed by ELISA at 2 weeks post-boost in the serum of mock (n = 5 mice), SPF (n = 9 mice), GF and GF mice colonised at day 21 with either the B. bifidum (GF + B.bif) or L. acidophilus (GF + L.acid) strains isolated from the Infloran probiotic (n = 8 mice per group). (s) 16S rRNA gene sequencing of faecal samples (n = 4 mice per group) was used to confirm colonisation with the Infloran strains. (t) Bacterial load was assessed using 16S rRNA gene qPCR in the indicated mice (n = 8 GF, n = 4 colonised and n = 6 SPF mice). PCV13-specific IgGtotal antibodies were assessed by ELISA in the serum of mock and PCV13 vaccinated SPF, GF or GF mice colonised with (u) L. murinus (n = 5 mice), L. plantarum (n = 5 mice), E. gallinarum (n = 4 mice), (v) A. muciniphila (n = 10 mice), B. acidifaciens (n = 10 mice) or (w) B. producta (n = 10 mice), E. cloacae (n = 5 mice). Mice in u-w were vaccinated at day 28 of life with two 3 μg doses of PCV13 vaccine i.p., two weeks apart. Data shown are at 2 weeks post-boost. Data in a-r, t-w are represented as mean ± SEM. Data in d-f, g, i-m are each representative of two independent experiments. Data in a-b, c, h, n-p, q-t, u, v, w are all from independent single experiments. Statistical significance was assessed in a-c using two-tailed Student’s t-test without adjustment for multiple comparisons, in d-h using two-way ANOVA with Tukey’s post-test analysis for multiple comparisons and in i-r, t-w using one-way ANOVA with Dunnett’s post-test analysis for multiple comparisons. *P < 0.05, **P < 0.01, ***P < 0.001, ****P < 0.001, ns = not significant. Exact P values are provided in the Source Data File. All P values are two-sided. Source data

References

    1. Lynn, M. A. et al. Early-life antibiotic-driven dysbiosis leads to dysregulated vaccine immune responses in mice. Cell Host Microbe23, 653–660 (2018). - PubMed
    1. Chapman, T. J., Pham, M., Bajorski, P. & Pichichero, M. E. Antibiotic use and vaccine antibody levels. Pediatrics149, e2021052061 (2022). - PMC - PubMed
    1. Shaffer, M. et al. Very early life microbiome and metabolome correlates with primary vaccination variability in children. mSystems8, e0066123 (2023). - PMC - PubMed
    1. Pichichero, M. E., Xu, L., Gonzalez, E., Pham, M. & Kaur, R. Variability of vaccine responsiveness in young children. J. Infect. Dis.229, 1856–1865 (2024). - PMC - PubMed
    1. Andre, F. E. et al. Vaccination greatly reduces disease, disability, death and inequity worldwide. Bull. World Health Organ.86, 140–146 (2008). - PMC - PubMed

MeSH terms

LinkOut - more resources