. 2025 Apr 2;15(1):11310.
doi: 10.1038/s41598-025-96004-8.

Altered metabolic profiles in colon and rectal cancer

Affiliations

Altered metabolic profiles in colon and rectal cancer

Xue Wu et al. Sci Rep. .

Abstract

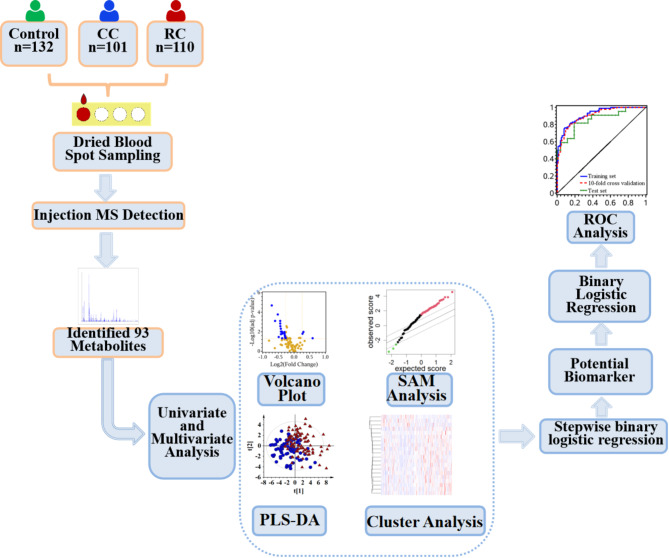
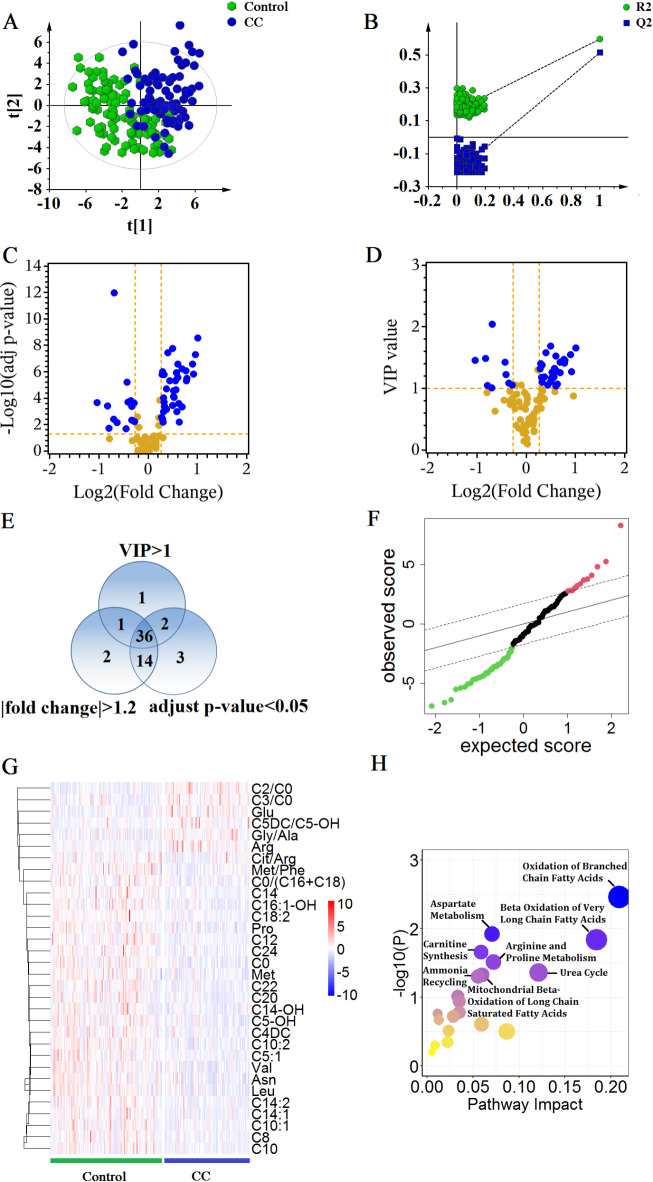
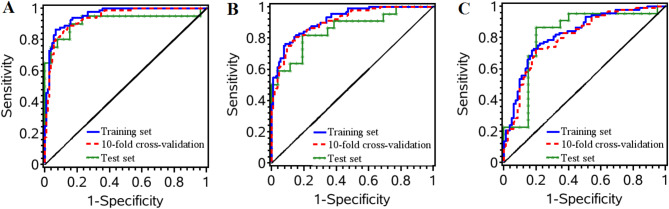
Colorectal cancer (CRC) is the third most commonly diagnosed malignant tumour in worldwide populations. Although colon cancer (CC) and rectal cancer (RC) are often discussed together, there is a global trend towards considering them as two separate disease entities. It is necessary to choice the appropriate treatment for CC and RC based on their own characteristics. Hence, it is a great importance to find effective biomarkers to distinguish CC from RC. In the present study, a total of 343 participants were recruited, including 132 healthy individuals, 101 patients with CC, and 110 patients with RC. The concentrations of 93 metabolites were determined by using a combination of dried blood spot sampling and direct infusion mass spectrometry technology. Multiple algorithms were applied to characterize altered metabolic profiles in CC and RC. Significantly altered metabolites were screened for distinguishing RC from CC in training set. A biomarker panel including Glu, C0, C8, C20, Gly/Ala, and C10:1 was tested with tenfold cross-validation and an independent test set, and showed the potential to distinguish between RC and CC. The metabolomics analysis makes contribution to summarize the metabolic differences in RC and CC, which might provide further guidance on novel clinical designs for the two diseases.

Keywords: Colon cancer; Dried blood spot sampling; Mass spectrometry; Metabolomics; Rectal cancer.


Conflict of interest statement

Declarations. Competing interests: The authors declare no competing interests. Institutional review board statement: This study was approved by Ethics Committee of the First Affiliated Hospital of Jinzhou Medical University. Informed consent: This study was conducted in accordance with the principles of the Declaration of Helsinki. Written informed consent was provided from each research participants.

Figures

Fig. 1
Fig. 1
Study design, data collection and analysis workflow. CC: colon cancer; RC: rectal cancer; MS: mass spectrometry; SAM: significance analysis of micro arrays; PLS-DA: partial least squares discriminant analysis; ROC: receiver operating characteristic.
Fig. 2
Fig. 2
Metabolic profiles of blood amino acids and carnitine/acylcarnitines to distinguish patients with CC from HC. (A) PLS-DA score plot. (B) Statistical significance of obtained PLS-DA model was evaluated by 200-times permutation test. The R2-intercept and Q2-intercept in permutation test were 0.1640 and − 0.2090, respectively. (C) Volcano plot by unifying adjusted p-value and log2 FC. Significantly altered metabolites were identified with adjusted p-value < 0.05 and FC > 1.2 or < − 1.2. The selected metabolites were colored in blue. (D) The volcano plot by unifying VIP and log2 FC. Metabolites with VIP > 1 and FC > 1.2 or < −1.2 were identified. (E) Venn diagram represented the altered metabolites between patients with CC and HC based on volcano plot analysis. Thirty-six metabolites were selected with adjusted p-value < 0.05 and VIP > 1 and FC > 1.2 or < − 1.2. (F) SAM method for analysis of a two-sample significance in patients with CC and HC. (G) Heat map cluster analysis for the 36 selected metabolites. Red colors characterize upregulated metabolites, and blue colors characterize downregulated metabolites in patients with CC compared with HC. (H) Pathway enrichment analysis for the data of differential metabolites between the two groups. Abbreviation: CC: colon cancer; HC: healthy control; PLS-DA: partial least squares discriminant analysis; FC: fold change; VIP: PLS-DA variable importance projection; SAM: significance analysis of micro arrays.
Fig. 3
Fig. 3
Metabolic profiles of blood amino acids and carnitine/acylcarnitines to distinguish patients with RC from HC. (A) PLS-DA score plot. (B) Statistical significance of obtained PLS-DA model was evaluated by 200-times permutation test. The R2-intercept and Q2-intercept in permutation test were 0.1770 and − 0.2220, respectively. (C) Volcano plot by unifying adjusted p-value and log2 FC. Significantly altered metabolites were identified with adjusted p-value < 0.05 and FC > 1.2 or < − 1.2. The selected metabolites were colored in blue. (D) The volcano plot by unifying VIP and log2 FC. Metabolites with VIP > 1 and FC > 1.2 or <− 1.2 were identified. (E) Venn diagram represented the altered metabolites between patients with RC and HC based on volcano plot analysis. Twenty-three metabolites were selected with adjusted p-value < 0.05 and VIP > 1 and FC > 1.2 or < − 1.2. (F) SAM method for analysis of a two-sample significance in patients with RC and HC. (G) Heat map cluster analysis for the 23 selected metabolites. Red colors characterize upregulated metabolites, and blue colors characterize downregulated metabolites in patients with RC compared with HC. (H) Pathway enrichment analysis for the data of differential metabolites between the two groups. Abbreviation: RC: rectal cancer; HC: healthy control; PLS-DA: partial least squares discriminant analysis; FC: fold change; VIP: PLS-DA variable importance projection; SAM: significance analysis of micro arrays.
Fig. 4
Fig. 4
Metabolic profiles of blood amino acids and carnitine/acylcarnitines to distinguish RC from CC. (A) PLS-DA score plot. (B) Statistical significance of obtained PLS-DA model was evaluated by 200-times permutation test. The R2-intercept and Q2-intercept in permutation test were 0.2140 and − 0.2090, respectively. (C) Volcano plot by unifying adjusted p-value and log2 FC. Significantly altered metabolites were identified with adjusted p-value < 0.05 and FC > 1.2 or <− 1.2. The selected metabolites were colored in blue. (D) The volcano plot by unifying VIP and log2 FC. Metabolites with VIP > 1 and FC > 1.2 or <− 1.2 were identified. (E) Venn diagram represented the altered metabolites between CC and RC based on volcano plot analysis. Twenty metabolites were selected with adjusted p-value < 0.05 and VIP > 1 and FC > 1.2 or < − 1.2. (F) SAM method for analysis of a two-sample significance in CC and RC. (G) Heat map cluster analysis for the 20 selected metabolites. Red colors characterize upregulated metabolites, and blue colors characterize downregulated metabolites in RC compared with CC. (H) Pathway enrichment analysis for the data of differential metabolites between the two groups. Abbreviation: CC: colon cancer; RC: rectal cancer; PLS-DA: partial least squares discriminant analysis; FC: fold change; VIP: PLS-DA variable importance projection; SAM: significance analysis of micro arrays.
Fig. 5
Fig. 5
The ROC curves towards selected metabolites HC, patients with CC, and patients with RC. (A) ROC curves of binary logistic regression for distinguishing patients with CC from HC. (B) ROC curves for distinguishing patients with RC from HC. (C) ROC curves for distinguishing RC from CC. The curve marked with blue line was for training set, red dash for tenfold cross-validation, and green star for test set. Abbreviation: ROC: receiver-operating characteristic; HC: healthy control; CC: colon cancer; RC: rectal cancer.

References

    1. Sung, H. et al. Global cancer statistics 2020: GLOBOCAN estimates of incidence and mortality worldwide for 36 cancers in 185 countries. CA Cancer J. Clin.71 (3), 209–249 (2021). - PubMed
    1. Kalaei, Z. et al. The prognostic and therapeutic value and clinical implications of fibroblast activation protein-α as a novel biomarker in colorectal cancer. Cell. Commun. Signal.21 (1), 139 (2023). - PMC - PubMed
    1. Bray, F. et al. Global cancer statistics 2018: GLOBOCAN estimates of incidence and mortality worldwide for 36 cancers in 185 countries. CA Cancer J. Clin.68 (6), 394–424 (2018). - PubMed
    1. Fathi, M. et al. T-cell Immunoglobulin and ITIM domain, as a potential immune checkpoint target for immunotherapy of colorectal cancer. IUBMB Life. 73 (5), 726–738 (2021). - PubMed
    1. Sumransub, N., Vantanasiri, K., Prakash, A. & Lou, E. Advances and new frontiers for immunotherapy in colorectal cancer: Setting the stage for neoadjuvant success? Mol. Ther. Oncolytics. 22, 1–12 (2021). - PMC - PubMed

Substances

LinkOut - more resources