. 2025 Apr;27(4):591-604.
doi: 10.1038/s41556-025-01639-4. Epub 2025 Apr 2.

Modulation of bone marrow haematopoietic stem cell activity as a therapeutic strategy after myocardial infarction: a preclinical study

Affiliations

Modulation of bone marrow haematopoietic stem cell activity as a therapeutic strategy after myocardial infarction: a preclinical study

Jasmin Rettkowski et al. Nat Cell Biol. 2025 Apr.

Abstract

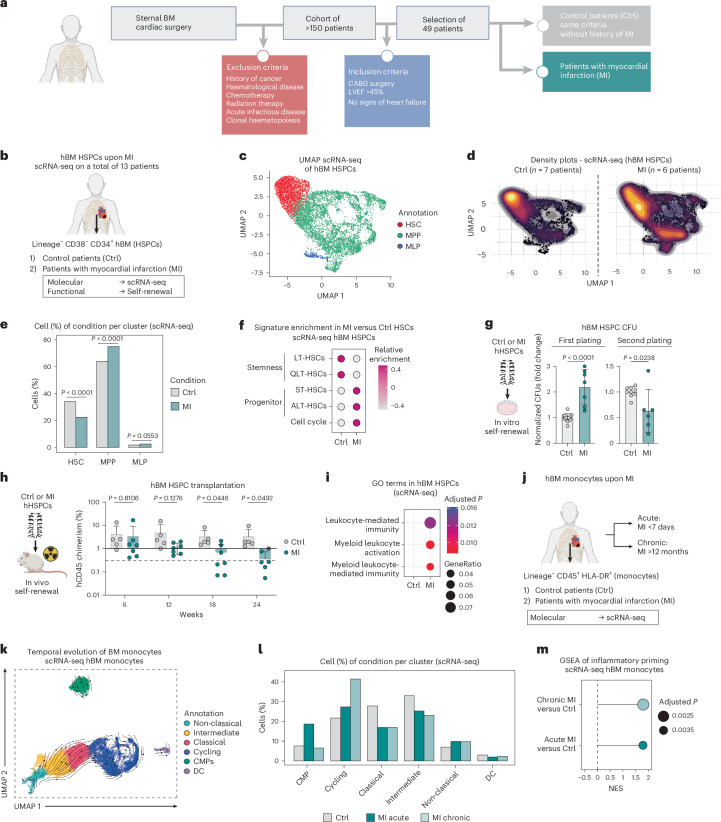
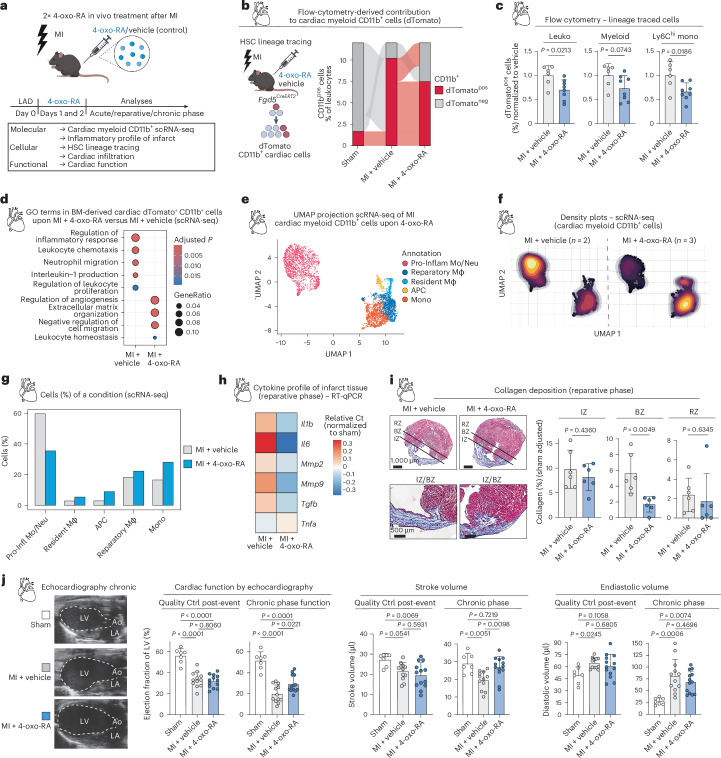
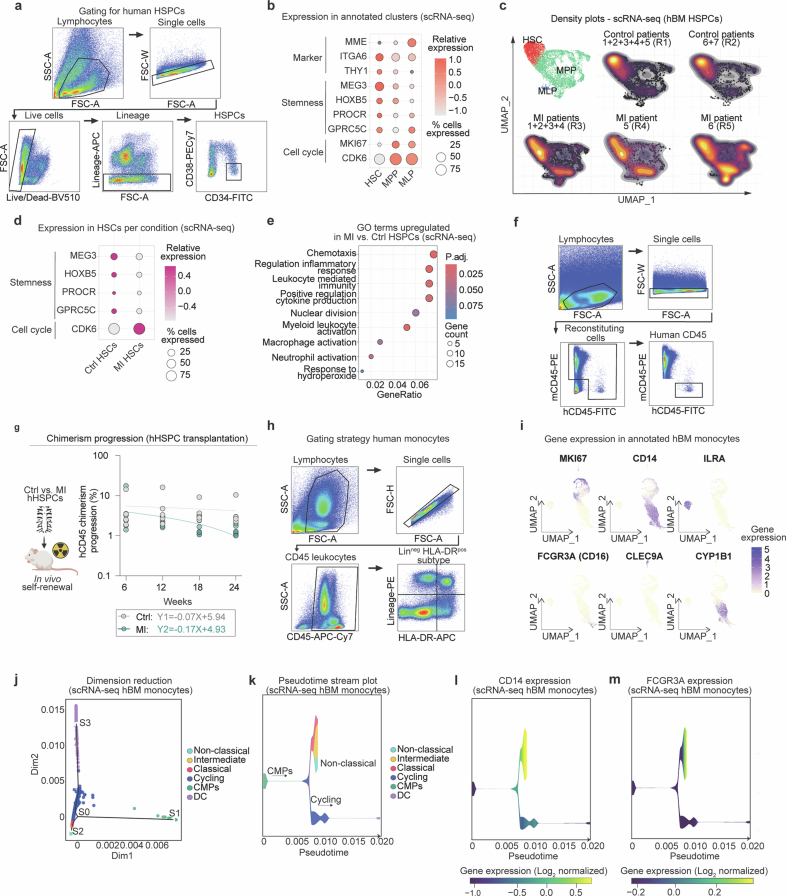
Myocardial infarction (MI) is a major global health concern. Although myeloid cells are crucial for tissue repair in emergency haematopoiesis after MI, excessive myelopoiesis can exacerbate scarring and impair cardiac function. Bone marrow (BM) haematopoietic stem cells (HSCs) have the unique capability to replenish the haematopoietic system, but their role in emergency haematopoiesis after MI has not yet been established. Here we collected human sternal BM samples from over 150 cardiac surgery patients, selecting 49 with preserved cardiac function. We show that MI causes detrimental transcriptional and functional changes in human BM HSCs. Lineage tracing experiments suggest that HSCs are contributors of pro-inflammatory myeloid cells infiltrating cardiac tissue after MI. Therapeutically, enforcing HSC quiescence with the vitamin A metabolite 4-oxo-retinoic acid dampens inflammatory myelopoiesis, thereby modulating tissue remodelling and preserving long-term cardiac function after MI.


Conflict of interest statement

Competing interests: The authors declare no competing interests.

Figures

Fig. 1
Fig. 1. MI leads to persistent activation and impaired functionality of human HSCs.
a, Patient selection flowchart. The diagram illustrates the process of patient cohort selection from initial BM collection to the final categorization into control patients (Ctrl) with no history of MI and those with MI. LVEF, left ventricular EF. b, Experimental design to characterize sternal human (h)BM HSPCs of MI and control donors. c, UMAP plot of scRNA-seq on human BM HSPCs upon MI coloured by cell type annotation. n = 7 Ctrl; n = 6 MI. d, UMAP density plots of control and MI-HSPCs depicting relative cell abundance. e, Bar plot of quantified relative cluster abundance in control and MI HSCs. Fisher tests. f, Relative enrichment scoring of published human HSPC signatures in control and MI HSCs. LT-HSCs, long-term HSCs; QLT-HSCs, quiescent long-term HSCs; ST-HSCs, short-term HSCs; ALT-HSCs, activated long-term HSCs. g, First and second plating of HSPC CFU assay comparing MI and control HSPCs. Two-tailed unpaired t-test. n = 9–11 Ctrl; n = 6–7 MI. h, Flow-cytometry-based analysis of human CD45 chimerism in HSPC transplantation assay of MI or control condition in NBSGW mice. The percentage of chimerism in PB was monitored over a time course of 24 weeks. Two-tailed unpaired t-test. n = 5 Ctrl; n = 7 MI. i, GO term enrichment of scRNA-seq MI and control DEGs (log2 fold change (FC) threshold 0.2, adjusted P value <0.1). j, Experimental design to characterize human sternal BM monocytes of MI acute, MI chronic and control donors. k, UMAP plot of scRNA-seq on human BM monocytes coloured by cell type annotation. The arrows show the RNA velocity vectors. n = 2 per condition. DC, dendritic cells. l, Bar plot of quantified relative cluster abundance in control, MI acute and MI chronic monocytes. m, GSEA of inflammatory-macrophage signature in MI acute and chronic versus control monocytes (merge of annotated clusters ‘classical’, ‘intermediate’ and ‘non-classical’). Data are presented as mean ± standard deviation. In cm, n indicates the number of human BM donors (biological replicates). Source data
Fig. 2
Fig. 2. HSCs contribute to inflammatory myeloid cell infiltration in the heart.
a, Experimental design for tracing the lineage of HSC responses following LAD artery ligation upon MI using the Fgd5CreERT2 mouse model. Fgd5CreERT2 mice express a tamoxifen-inducible CreERT2 recombinase and green fluorescent protein (ZsGreen) in the Fgd5 locus, which is highly active in HSCs. The expression of red fluorescent protein (tdTomato) is controlled by a loxP-flanked STOP cassette. Upon Cre-mediated recombination, dTomato fluorescence is observed. The dTomato expression is compared between (1) baseline mice undergoing induction without any surgical intervention, (2) non-ischaemic sham surgery mice and (3) LAD-ligated mice to simulate MI conditions. EH in Fgd5CreERT2 mice is evaluated during the acute phase at day 3 after MI. b, Flow-cytometry-based analysis of lineage-traced BM progenitors in Fgd5CreERT2 mice. The percentage of dTomatopos cells is normalized to the dTomato label within the HSC compartment across the progenitors: HSCs, MPPs and MyP at baseline, after sham surgery and after MI. Ordinary two-way analysis of variance (ANOVA). Red P value, baseline versus sham; grey P value, sham versus MI; black P value, MI versus baseline. n = 6 vehicle; n = 6 sham; n = 3 baseline. c, Flow-cytometry-based plots, illustrating the percentage of lineage-traced dTomatopos cell frequencies of myeloid cells upon MI or sham surgery in BM of Fgd5CreERT2 mice. Ordinary two-way ANOVA. n = 6 vehicle; n = 6 sham; n = 3 baseline. Leuko, leukocytes. d, Sections of myocardium stained with DAPI after MI. The counts of dTomatopos cells are normalized to DAPI counts. Scale bar, 100 µm. Two-tailed unpaired t-test. n = 7 sham; n = 5 MI. e, Alluvial plot of contribution from dTomatopos and dTomatoneg, CD11bpos cells to the myocardium upon MI. The y axis is reduced for visualization purposes. f, Flow-cytometry-based representative UMAP plots calculated on downsampled cells isolated from myocardium. The plots are representative for four sham mice and two MI mice. g, Flow-cytometry-based plots, illustrating the percentage of lineage-traced dTomatopos leukocyte frequencies upon MI or sham surgery of Fgd5CreERT2 mice in the myocardium. Ordinary two-way ANOVA. n = 4 sham; n = 6 MI. Leuko, leukocytes; Ly6c2hi mono, Ly6c2-high monocytes. h, Volcano plot of DEGs between dTomatopos and dTomatoneg mouse CD11bpos cardiac MI cells in scRNA-seq. i, UMAP plot of scRNA-seq on mouse cardiac CD11bpos cells in MI coloured by cell type annotation. Pro-Inflam Mo/Neu, pro-inflammatory monocytes and neutrophils; reparatory Mφ, reparatory macrophages; resident Mφ, resident macrophages; APC, antigen-presenting cells; Mono, monocytes. n = 2 per condition. j, UMAP density plots of dTomatopos and dTomatoneg CD11bpos cells in the myocardium upon MI depicting relative cell abundance. k, Stacked bar plot of quantified relative cluster abundance in dTomatopos and dTomatoneg CD11bpos cells in myocardium upon MI. Data are presented as mean ± standard deviation. In bi, n indicates the number of biological replicates. For be and g, four independent experiments were performed. Source data
Fig. 3
Fig. 3. Regulation of MI-HCSs by vitamin A metabolites.
a, GO term enrichment of upregulated DEGs (log2FC threshold 0.8, adjusted P value <0.05) in human control HSCs in comparison with MI HSCs based on scRNA-seq. b, Experimental design to characterize human BM HSCs isolated from healthy donors. HSCs were treated in vitro with RA metabolites (at-RA or 4-oxo-RA) or DMSO as control. c, GSEA of published human HSPC signatures in DEGs between 4-oxo-RA and at-RA treatments versus control from healthy human donors based on population RNA-seq. d, Second plating of CFU of human HSCs after in vitro cultivation with RA metabolites or control treatment. Ordinary one-way ANOVA. n = 6 Ctrl; n = 4 at-RA; n = 5 4-oxo-RA. e, scHSC division assay of HSCs isolated from BM healthy donors and in vitro cultured with RA metabolites or DMSO. Depicted P values correspond to the percentage of non-divided cells. Statistics denote comparisons between at-RA or 4-oxo-RA condition and the control condition. Ordinary two-way ANOVA. n = 7 Ctrl; n = 9 at-RA; n = 9 4-oxo-RA. f, Experimental design to characterize HSC response after at-RA in vivo treatment after MI. n = 4 vehicle; n = 3 at-RA; n = 2 sham. g, GSEA of published mouse HSPC signatures in vehicle versus sham HSCs in day-2 post-MI population RNA-seq. h, GSEA profile of HSC signature in at-RA versus vehicle HSCs upon MI. RES, running enrichment score. i, Flow-cytometry-based analysis of HSC cell cycle of sham, MI + vehicle and MI + at-RA conditions. The percentage of cell-cycle phases (G0, G1 and G2/S/M) is shown. Depicted P values correspond to the percentage of cells in the G0 phase. Statistics denote comparisons between vehicle or at-RA condition and the sham condition. Ordinary two-way ANOVA. n = 6 sham; n = 11 vehicle; n = 13 at-RA. j, scHSC division assay after 48 h in sham, MI + vehicle and MI + at-RA HSCs. The percentage of cells is shown. Depicted P values correspond to the percentage of non-divided cells. Statistics denote comparisons between vehicle or at-RA condition and the sham condition. Ordinary two-way ANOVA. n = 6 sham; n = 11 vehicle; n = 13 at-RA. k,l, Flow-cytometry-based analysis of leukocyte frequencies during EH in the acute phase at day 2 after MI. The percentage of leukocyte cell frequencies is depicted in BM and myocardium. Ordinary one-way ANOVA (k: n = 12 sham; n = 11 vehicle; n = 12 at-RA; l: n = 9 sham; n = 11 vehicle; n = 12 at-RA). GMPs, granulocyte-macrophage progenitors. m, Quantification of myocardium CD11bpos immunohistochemistry (IHC) stainings of vehicle and at-RA condition in the chronic phase at day 28 after MI. Two-tailed unpaired t-test. n = 11 vehicle; n = 8 at-RA. n, The percentage of EF of LV based on echocardiography performed during the acute phase at day 1 after MI and during the chronic phase at day 21 after MI for each condition. Ordinary one-way ANOVA. n = 5 sham; n = 9 vehicle; n = 9 at-RA. LV, left ventricle. o, Expression profiles of RA receptors in BM and cardiac cells. Left: real time (RT)-qPCR in BM HSPCs, differentiated immune cells and niche cells. Normalized mean relative to Oaz1 expression and relative to HSCs is shown. n = 3 per condition. Ct, cycle treshold. Right: heatmap of normalized counts in cardiac cell population RNA-seq dataset. n = 3 Mono; n = 4 Mφ; n = 3 FB; n = 4 EC. Mono, monocytes; Mφ, macrophages; FB, fibroblasts; EC, endothelial cells. p, GSEA of published mouse inflammatory-macrophage signature in cardiac monocytes and macrophages isolated from mice after 24 h in vivo treatment with at-RA or DMSO (vehicle), based on population RNA-seq. n = 3 Mono vehicle; n = 4 Mono at-RA; n = 4 Mφ vehicle; n = 3 Mφ at-RA. In gl, cells were isolated in the acute phase at days 2–3 after MI. Data are presented as mean ± standard deviation. In ce, n indicates the number of human BM donors per condition (biological replicates). In gp, n indicates the number of biological replicates per condition. For ce and jp, two or more independent experiments were performed. Source data
Fig. 4
Fig. 4. 4-oxo-RA safeguards HSC functionality upon MI.
a, Schematic representation of RA metabolite signalling (at-RA and 4-oxo-RA) comparing HSCs and myeloid cells. b, GSEA of published mouse inflammatory-macrophage signature in cardiac monocytes, macrophages (Mφ), endothelial cells (EC) and fibroblasts isolated from mice after 24 h in vivo treatment with 4-oxo-RA or DMSO (vehicle), based on population RNA-seq. n = 3 Mono vehicle; n = 3 Mono 4-oxo-RA; n = 4 Mφ vehicle; n = 4 Mφ 4-oxo-RA; n = 3 fibroblasts vehicle; n = 4 fibroblasts 4-oxo-RA; n = 4 ECs vehicle; n = 4 ECs 4-oxo-RA. ns, non-significant. c, Experimental design to characterize HSC response after 4-oxo-RA in vivo treatment following MI. d, UMAP plot of scRNA-seq on BM HSPC cells (Lineageneg, cKitneg, Sca1pos) isolated from mice that received in vivo treatment with vehicle (DMSO) or 4-oxo-RA after MI, as well as from mice undergoing sham surgery. n = 2 per condition. e, UMAP density plots of each condition in BM HSPC scRNA-seq depicting relative cell abundance. f, Quantification bar plot of relative cluster abundance in each BM HSPC scRNA-seq condition. Fisher tests. g, GSEA of published mouse HSPC signatures in 4-oxo-RA versus vehicle HSC cluster upon MI based on scRNA-seq. h, Flow-cytometry-based plots, illustrating the percentage of dTomatopos cell frequencies of BM progenitors for sham, MI + vehicle and MI + 4-oxo-RA conditions in the BM. Each percentage is normalized to dTomato labelling within the corresponding HSC compartment. Data are presented as mean ± standard deviation. Ordinary two-way ANOVA. Black P value, sham vervsus MI + vehicle; blue P value, MI + vehicle versus MI + 4-oxo-RA; grey P value, MI + 4-oxo-RA versus sham. n = 5 sham; n = 6 vehicle; n = 8 4-oxo-RA. i, Flow-cytometry-based plots, illustrating the percentage of dTomatopos cell frequencies for the vehicle and 4-oxo-RA conditions in the BM upon MI. Cell frequencies are normalized to the vehicle condition. Data are presented as mean ± standard deviation. Ordinary two-way ANOVA. n = 6 vehicle; n = 8 4-oxo-RA. j, Flow-cytometry-based analysis of HSC cell cycle of sham, MI + vehicle and MI + 4-oxo-RA conditions. The percentage of cell-cycle phases (G0, G1 and G2/S/M) is shown. Depicted P values correspond to the percentage of cells in the G0 phase. The statistics denote comparisons between vehicle or 4-oxo-RA condition and the sham condition. Ordinary two-way ANOVA. n = 7 sham; n = 10 vehicle; n = 11 4-oxo-RA. k, scHSC division assay after 48 h in sham, MI + vehicle and MI + 4-oxo-RA HSCs. The percentage of cells is shown. Depicted P values correspond to the percentage of non-divided cells. The statistics denote comparisons between vehicle or 4-oxo-RA condition and the sham condition. Ordinary two-way ANOVA. n = 7 sham; n = 10 vehicle; n = 11 4-oxo-RA. l, Third plating of HSC CFU assay comparing sham, vehicle and 4-oxo-RA conditions upon MI. Ordinary one-way ANOVA. n = 7 sham; n = 10 vehicle; n = 9 4-oxo-RA. m, Flow-cytometry-based analysis of CD45.2 PB chimerism in primary HSC transplantation assays of vehicle and 4-oxo-RA condition (CD45.2). The percentage of chimerism in PB was monitored over a time course of 16 weeks; radio-resistant cells were excluded. Ordinary two-way ANOVA. n = 9 vehicle; n = 10 4-oxo-RA. n, Flow-cytometric analysis of CD45.2 chimerism at 16 weeks in BM. Two-tailed unpaired t-test. n = 9 per condition. o, UMAP plot of scRNA-seq on mouse spleen HSPC cells isolated from vehicle and 4-oxo-RA conditions upon MI. n = 2 per condition. p, UMAP density plots of vehicle and 4-oxo-RA spleen HSPC scRNA-seq upon MI depicting relative cell abundance. q, Bar plot of quantified relative cluster abundance in vehicle and 4-oxo-RA spleen HSPC scRNA-seq upon MI. r, GSEA profile of cell-cycle pathway in 4-oxo-RA versus vehicle HSCs scRNA-seq upon MI. In dl and or, cells were isolated in the acute phase at day 3 after MI. Data are presented as mean ± standard deviation. n indicates the number of biological replicates per condition. For b and hn, three or more independent experiments were performed. Source data
Fig. 5
Fig. 5. 4-oxo-RA preserves long-term cardiac function via Rarβ upon MI.
a, Experimental design to characterize HSC response after 4-oxo-RA in vivo treatment following MI. b, Alluvial plot of contribution from dTomatopos and dTomatoneg cells to cardiac CD11bpos myeloid cells in sham, vehicle and 4-oxo-RA upon MI based on flow cytometry. The y axis is reduced for visualization purposes. c, Flow-cytometry-based plots, illustrating the percentage of dTomatopos cell frequencies for the vehicle and 4-oxo-RA condition in the myocardium upon MI. Cell frequencies are normalized to the vehicle condition. Data are presented as mean ± standard deviation. Ordinary two-way ANOVA. n = 6 vehicle; n = 8 4-oxo-RA. d, GO term enrichment of DEGs (top 200 log2FC, adjusted P value <0.05) in MI + vehicle compared with MI + 4-oxo-RA dTomatopos myeloid cells based on scRNA-seq. e, UMAP plot of 4-oxo-RA mouse cardiac CD11bpos cells scRNA-seq upon MI, based on projection on previously shown vehicle scRNA-seq. The colours indicate the predicted cell type annotation. n = 2 vehicle; n = 3 4-oxo-RA. f, UMAP density plots of vehicle and projected 4-oxo-RA mouse cardiac CD11bpos cells scRNA-seq upon MI depicting relative cell abundance. g, Bar plot of quantified relative cluster abundance in MI + vehicle and projected MI + 4-oxo-RA mouse cardiac CD11bpos cells scRNA-seq. h, Expression profiles of cytokines in cardiac cells in vehicle and 4-oxo-RA conditions in the reparative phase at day 10 after MI. Normalized mean relative to Oaz1 expression and relative to sham surgery is shown. Values are relative to the average per gene. n ≥ 4 per gene. i, Masson’s Trichrome staining for collagen deposition in myocardial zones in MI + vehicle and MI + 4-oxo-RA. The lines highlight the separated areas in representative images. Two-tailed unpaired t-test. n = 6 per condition. RZ, remote zone; BZ, border zone; IZ, infarct zone. j, Cardiac functional assessment by echocardiography. Left: graphic representation of echocardiography during diastole. Ao, ascending aorta; LV, left ventricle; LA, left atrium. Right: quantification of echocardiographic parameters: EF, stroke volume and end-diastolic volume, comparing the quality control at day 1 with the chronic phase function at day 28 across treatment conditions after MI. Ordinary one-way ANOVA. n = 7 sham; n = 12 vehicle; n = 13 4-oxo-RA. In bg, cells were isolated in the acute phase at day 3 after MI. Data are presented as mean ± standard deviation. n indicates the number of biological replicates per condition. For b, c, h and j, three or more independent experiments were performed. Source data
Fig. 6
Fig. 6. 4-oxo-RA restores human HSC function after MI and mitigates at-RA-induced human monocyte inflammation.
a, Experimental design to characterize human sternal BM HSPCs of MI and control (Ctrl) donors after in vitro treatment with 4-oxo-RA. b, GSEA of published human HSPC signatures in human HSPCs upon in vitro culture with 4-oxo-RA treatment versus control (DMSO) from patients with MI based on population RNA-seq. n = 2 per condition. c, scHSPC division assay after 48 h in MI-HSPCs after in vitro treatment with 4-oxo-RA or control (DMSO). The percentage of cells is shown. Depicted P values correspond to the percentage of non-divided cells. Ordinary two-way ANOVA. n = 3 per condition. d, First and second plating of human MI-HSPC CFU assay after in vitro treatment with 4-oxo-RA or control (DMSO). Two-tailed unpaired t-test. n = 6 per condition. e, Volcano plots of DEGs between 4-oxo-RA and DMSO (Ctrl) treatment in human BM HSPCs from healthy donors. DEGs that are common in previously published 4-oxo-RA and DMSO (Ctrl) treatment in mouse BM HSCs (log2FC threshold 0.5, adjusted P value <0.1) are coloured in red (upregulated) or green (downregulated). In total, 94 out of 331 upregulated human genes were conserved in mouse (28%), while 32 out of 142 genes (23%) were downregulated in both species. Important genes are annotated. f, GSEA of mouse RA direct target gene list in human HSPCs upon 4-oxo-RA treatment versus control (DMSO) from healthy donors based on population RNA-seq. g, UMAP plots showing expression levels of RARA and RARB genes in human BM monocyte scRNA-seq. h, Experimental design to characterize human PB monocytes (monocyte-enriched culture) of healthy donors after in vitro treatment with control (DMSO), at-RA and 4-oxo-RA. n = 4 per condition. i, GSEA of IFN-γ response signature in human PB monocytes upon at-RA treatment versus control (DMSO) and 4-oxo-RA versus at-RA treatments from healthy donors based on population RNA-seq. j, Cytokine secretion assay in supernatant of human PB monocyte cultures from healthy donors upon control (DMSO), at-RA and 4-oxo-RA treatments. k, ICAM-1 expression in human PB monocytes (CD14pos and/or CD16pos monocytes) from healthy donors upon control (DMSO), at-RA and 4-oxo-RA treatments. MFI, mean fluorescence intensity. The central line denotes the median; the boxes denote lower and upper quartiles (Q1 and Q3, respectively); the whiskers represent the minimum and maximum values. n = 12–13. l, Reactive oxygen species (ROS) levels assessed by CellROX in human PB intermediate monocytes (CD14pos CD16pos) from healthy donors upon control (DMSO), at-RA and 4-oxo-RA treatments. MFI, mean fluorescence intensity. The central line denotes the median; the boxes denote lower and upper quartiles (Q1 and Q3, respectively); the whiskers represent the minimum and maximum values. n = 5–6. m, Schematic representation of main findings. Data are presented as mean ± standard deviation. n indicates the number of biological replicates (mice or human BM donors) per condition. For c, d, k and l, three or more independent experiments were performed. Source data
Extended Data Fig. 1
Extended Data Fig. 1. MI affects human bone marrow HSCs and monocytes.
a, Representative gating scheme for flow cytometric cell sorting of human HSPCs. b, Relative expression dot plot of published human HSPCs markers in annotated clusters of human BM HSPCs scRNA-seq. Dot size corresponds to the percentage of cells expressing the depicted genes. c, UMAP scRNA-seq density plots of control and MI HSPCs in each experiment showing relative cell abundance. Pooled patients per reaction are depicted. R, Reaction. d, Relative expression dot plot of published human HSPCs markers comparing control and MI in the annotated HSC cluster of human BM HSCs scRNA-seq. Dot size corresponds to the percentage of cells expressing the depicted genes. e, GO terms enrichment of upregulated DEGs (log2FC threshold = 0.1, P.adj < 0.1) in human MI HSCs in comparison to control HSCs based on scRNA-seq. e, Representative gating scheme for flow cytometric analysis of human CD45 chimerism in PB in NBSGW mice. f, Representative gating scheme for flow cytometric analysis of human chimerism in transplanted NBSGW mice. g, Regression model of human CD45 chimerism in PB in NBSGW mice upon MI. h, Representative gating scheme for flow cytometric analysis of human monocytes in BM. i, UMAP plots showing expression levels of published human BM monocyte annotation markers in scRNA-seq. j, scRNA-seq on human BM monocytes ordered in low dimensional space together with trajectories inferred by STREAM. Cells are colored by the cell annotation. k, Stream plot showing cell density in different trajectories along pseudotime. Cells are colored by the cell annotation. l, Stream pseudotime plot colored by CD14 expression. m, Stream pseudotime plot colored by FCGR3A (CD16) expression. Source data
Extended Data Fig. 2
Extended Data Fig. 2. HSC-derived myeloid cells infiltrate the myocardium post-MI.
a, Heatmap showing Fgd5 and selected cardiac marker gene expression in all cell types from adult mouse heart, obtained from Fei et al., 2022. Expression data is presented as log2-transformed cluster mean transcripts per million (TPM + 1). b, t-SNE plot depicting Fgd5 gene expression in scRNA-seq of mouse BM Linneg c-Kitpos compartment from Dahlin et al., 2018. Expression levels are represented as log10(normalized counts + 1). c, Schematic design of the standard equilibrium tracing using Fgd5CreERT2 mice. Tracing is induced with tamoxifen injections, followed by a 4-week recovery before LAD ligation or sham surgery. Analysis is performed on day 3 post-MI. d,e, Flow cytometry-based plots, illustrating the percentage of lineage-traced dTomatopos cells upon MI or sham surgery. d, Frequencies of dTomatopos lymphoid cells in the BM. e, Frequencies of dTomatopos myeloid cardiac cells are normalized to dTomato label within the corresponding HSC compartment of each mouse. Data is presented as mean with standard deviation. Neutro, Neutrophils; Mono, Monocytes; Macro, Macrophages. Ordinary two-way ANOVA. n = 6 for MI, sham condition. n = 3 for baseline condition. f, Stainings of cardiac sections, illustrating the infiltrating dTomatopos cells upon MI or sham surgery in myocardium areas. Ordinary two-way ANOVA. n = 7-14. IZ, Infarct zone; BZ, Border zone; RZ, Remote zone. For (d-f) cells were isolated in the acute phase at day three after MI. Data are presented as mean ± standard deviation. n indicates the number of biological replicates per condition. For (c), three or more independent experiments were performed. Source data
Extended Data Fig. 3
Extended Data Fig. 3. Post-MI HSC-derived cardiac myeloid cells show a pro-inflammatory transcriptional program.
a, Schematic design of the short equilibrium tracing using Fgd5CreERT2 mice. Tracing is induced with tamoxifen injections, followed by a 10-day recovery before LAD ligation or sham surgery. Analysis is performed on day 3 post-MI. b, UMAP plot of scRNA-seq on mouse cardiac CD11bpos cells in MI colored by dTomato phenotype. n = 2. c, Relative expression dot plot of published mouse cardiac myeloid annotation markers in annotated clusters of CD11bpos (Fgd5CreERT2 mouse model) scRNA-seq. Dot size corresponds to the percentage of cells expressing the depicted genes. d, UMAP plots showing expression levels of published mouse cardiac CD11bpos annotation markers in scRNA-seq. e, Relative scoring enrichment dot plot of published macrophage-related and inflammatory signatures in annotated clusters of mouse cardiac CD11bpos scRNA-seq. f, Volcano plots of DEGs between dTomatopos and dTomatoneg mouse CD11bpos cardiac MI cells in each scRNA-seq subpopulation. Number of DEGs are depicted.
Extended Data Fig. 4
Extended Data Fig. 4. at-RA treatment modulates HSC activity post-MI but leads to accumulation of cardiac myeloid cells.
a, Detailed experimental design to characterize HSC response after in vivo at-RA treatment following MI. Readouts are shown at precise time points throughout acute, reparative and chronic phases of MI. b, GSEA of mouse RA metabolism signature in pairwise comparisons vehicle vs. sham and at-RA vs. vehicle HSCs at day 2 post-MI population RNA-seq. c, GSEA of Reactome pathways in at-RA vs. vehicle HSCs upon MI. d, Representative gating scheme for flow cytometric cell cycle analysis of HSCs. e, 1st, 2nd and 3rd plating of HSC CFU assay comparing sham, MI+vehicle and MI+at-RA condition. Two-tailed unpaired t-test. n = 5–11. f, Representative gating scheme for flow cytometric analysis of cardiac leukocytes during EH. g, Left, Flow cytometry-based analysis of HSPC cell frequencies during emergency hematopoiesis in the acute phase at day 2 post MI in BM. Center, Flow cytometry-based analysis of myeloid cell and macrophage cell frequencies in the myocardium during emergency hematopoiesis in the acute phase at day 2 post MI in BM. Right, Cardiac macrophage frequency normalized to mg of infarct tissue is depicted. Ordinary one-way ANOVA. B(M) n = 8–18. h, Representative images of myocardium CD11bpos immunohistochemistry (IHC) stainings of vehicle and at-RA condition in the chronic phase at day 28 post MI. RZ, Remote zone; BZ, Border zone; IZ, Infarct zone. Infiltrated CD11bpos are pointed with an arrow. i, Representative gating scheme for flow cytometric isolation of cardiac cell populations isolated from mice after in vivo at-RA or vehicle (DMSO) treatment. In (b-g) cells were isolated in the acute phase at day 2-3 after MI. Data are presented as mean ± standard deviation. n indicates the number of biological replicates per condition. For (e,g), three or more independent experiments were performed. Source data
Extended Data Fig. 5
Extended Data Fig. 5. Rarb expression is specific to HSCs and remains unchanged upon MI.
a, Heatmap illustrating the expression of RA receptor genes and cardiac, endothelial, and myeloid marker genes in all cell types from adult mouse heart, obtained from Fei et al., 2022. Expression levels are indicated by the log2-transformed cluster mean TPM + 1. b, t-SNE plot illustrating Rara, Rarb and Rarg gene expression in scRNA-seq of mouse BM Linneg c-Kitpos compartment from Dahlin et al., 2018. Expression levels are represented as log10(normalized counts + 1). c, qPCR expression profile of Rarb in bone marrow and cardiac populations in control and MI mice. Normalized mean relative to Oaz1 housekeeper expression is shown. n = 3-4. In c, cells were isolated 24 h after MI.
Extended Data Fig. 6
Extended Data Fig. 6. 4-oxo-RA safeguards HSCs upon MI.
a, Volcano plots of DEGs between 4-oxo-RA and DMSO (vehicle) treatment depicted for cardiac monocytes, macrophages, fibroblasts and endothelial cells. b, Detailed experimental design to characterize HSC response after in vivo 4-oxo-RA treatment following MI. Readouts are shown at precise time points throughout acute, reparative and chronic phases of MI. c, GSEA of Reactome pathways in 4-oxo-RA vs. vehicle BM HSC cluster upon MI based on scRNA-seq. d, Flow cytometry-based plots, illustrating the percentage of BM lineage-traced dTomatopos lymphoid cells upon MI or sham surgery and treatment in our short equilibrium tracing. Data is presented as mean with standard deviation in different timepoints. Ordinary two-way ANOVA. n = 3–4. e, Flow cytometry-based plots, illustrating the percentage of BM lineage-traced dTomatopos lymphoid cells upon MI or sham surgery and treatment in our standard equilibrium tracing. Data is presented as mean with standard deviation. Ordinary two-way ANOVA. n = 3–4. f, 1st and 2nd plating of HSC CFU assay comparing sham, vehicle and 4-oxo-RA conditions upon MI. Ordinary one-way ANOVA. n = 7–11. g, Representative gating scheme for flow cytometric analysis of HSC transplantation assay of 4-oxo-RA and vehicle condition. Percentage of CD45.2 PB chimerism was monitored over a time course of 16 weeks. Percentage of donor-derived lineage bias in B-cells, myeloid cells and T-cells was quantified at 16 weeks in BM. h, Flow cytometric analysis of donor-derived (CD45.2) lineage bias in B-cells, myeloid cells and T-cells in PB and BM at 16 weeks post transplantation. Ordinary two-way ANOVA. n = 8–10. In (c, e), cells were isolated in the acute phase at day 3 after MI. Data are presented as mean ± standard deviation. n indicates the number of biological replicates per condition. For (a, e and f), two or more independent experiments were performed. Source data
Extended Data Fig. 7
Extended Data Fig. 7. 4-oxo-RA reduces cardiac inflammation and fibrosis upon MI.
a, Representative gating scheme for flow cytometric analysis of dTomatopos cells in the myocardium of Fgd5CreERT2 mice upon MI. b, GSEA profile of healing-related signatures in scRNA-seq of 4-oxo-RA and vehicle (DMSO) treated dTomatopos cardiac myeloid cells upon MI. RES, Running enrichment score. c, Volcano plots of DEGs between 4-oxo-RA and vehicle (DMSO) treated dTomatopos cardiac MI myeloid cells in each scRNA-seq subpopulation. Number of DEGs are depicted. d, Masson’s Trichrome staining for collagen deposition in whole myocardium in MI+vehicle and MI + 4-oxo-RA. A representative image of sham staining is depicted.Two-tailed unpaired t-test. n = 6. RZ, Remote zone; BZ, Border zone; IZ, Infarct zone. e, Picrosirius Red staining for collagen deposition in myocardium and separated zones in MI+vehicle and MI + 4-oxo-RA. Two-tailed unpaired t-test. n = 5-8. Representative images of staining are shown. Arrows highlight collagen depositions. f, qPCR expression profile of collagen genes in cardiac fibroblasts in sham, vehicle, and 4-oxo-RA treatment groups. Normalized mean relative to Oaz1 expression is shown. n = 3-4. g, Left, Representative images and quantification of myocardium CD11bpos IHC stainings of vehicle and 4-oxo-RA condition in the chronic phase at day 28 post MI. Scale bar, 100 µm. Right, Quantification of myocardium CD11bpos IHC stainings of vehicle and 4-oxo-RA condition in the chronic phase at day 28 post MI. Two-tailed unpaired t-test. n = 10–11. h, Kaplan-Meier survival curves post MI and sham surgery. Mice were treated with either 4-oxo-RA or vehicle following MI and survival was monitored over a 10-day period. The survival probabilities for sham-operated, vehicle and 4-oxo-RA groups are depicted with ‘ns’ indicating non-significant differences between the groups. Mantel-Cox test. n = 35-41. In c, cardiac fibroblast were isolated 14 day after MI. In (f-h), cells were isolated in the acute phase at day three after MI. Data are presented as mean ± standard deviation. n indicates the number of biological replicates per condition or total number of human BM donors. Source data
Extended Data Fig. 8
Extended Data Fig. 8. Rarβ is indispensable for 4-oxo-RA’s beneficial effects.
a, Experimental design to characterize Rarβ KO HSC response after 4-oxo-RA in vivo treatment following MI. b, UMAP plot of scRNA-seq on BM HSPC cells isolated from Rarβ KO mice that received in vivo treatment with vehicle or 4-oxo-RA post MI, as well as from Rarβ KO mice undergoing sham surgery. n = 2. c, UMAP density plots of each condition in BM Rarβ KO HSPC scRNA-seq depicting relative cell abundance. d, Bar plot of quantified relative cluster abundance in each condition based on scRNA-seq data of BM Rarβ KO HSPC cells. e, GSEA of published mouse HSPC signatures in the pairwise comparisons between MI+vehicle vs. sham HSC cluster and MI + 4-oxo-RA vs. MI+vehicle HSC cluster based on Rarβ KO scRNA-seq. f, ScHSC division assay after 48 h in sham, MI+vehicle and MI + 4-oxo-RA Rarβ KO HSCs. The percentage of cells is shown. Depicted p values correspond to the percentage of non-divided cells. Statistics denote comparisons between vehicle or 4-oxo-RA condition and the sham condition. Ordinary two-way ANOVA. n = 5–6. g, 1st, 2nd and 3rd plating of Rarβ KO HSC CFU assay comparing sham, MI+vehicle and MI + 4-oxo-RA condition. Ordinary two-way ANOVA. n = 6. h and i, Flow cytometry-based analysis of emergency hematopoiesis in Rarβ KO mice during the acute phase at day three post MI. Percentage of leukocyte cell frequencies is depicted in BM and myocardium. Ordinary two-way ANOVA. BM and myocardium, n = 4–6. j, Left, Representative echocardiographic images showing left ventricular (LV) morphology during diastole in sham, MI with vehicle, and MI with 4-oxo-RA treatment groups. Ao, ascending aorta; LA, left atrium; LV, left ventricle. Right, Analysis of ejection fraction and endiastolic volume at day one post MI (as quality control) and in the chronic phase at day 28 post MI. Ordinary one-way ANOVA. n = 7-10. k, Left, Schematic design of chimera experiments to characterize the transplantation of BM Rarβ-KO cells into wildtype mice followed by MI and 4-oxo-RA in vivo treatment. Right, Analysis of ejection fraction, stroke volume and endiastolic volume in sham, MI with vehicle, and MI with 4-oxo-RA treatment groups at day one post MI (as quality control) and in the chronic phase at day 28 post MI. Ordinary one-way ANOVA. n = 8-11. In c, cardiac fibroblast were isolated 14 day after MI. In (a-e), cells were isolated in the acute phase at day three after MI. Data are presented as mean ± standard deviation. n indicates the number of biological replicates per condition or total number of human BM donors. For (b-e), two or more independent experiments were performed. Source data
Extended Data Fig. 9
Extended Data Fig. 9. at-RA modulates human MI-HSCs.
a, Left, Experimental design to characterize human sternal BM HSPCs of MI and Ctrl (control) donors after in vitro treatment with at-RA. Right, GSEA of published human HSPC signatures in human HSPCs upon in vitro culture with at-RA treatment vs. control (DMSO) from MI patients based on population RNA-seq. n = 2–4. b, GSEA of published human HSPC signatures in human HSPCs upon in vitro culture with at-RA treatment vs. control (DMSO) from MI patients based on population RNA-seq. n = 2–4. c, GO terms enrichment of upregulated DEGs (log2FC threshold = 0, P.adj < 0.1) in human MI-HSPCs with at-RA or 4-oxo-RA treatment vs. control (DMSO). d, ScHSPC division assay after 48 h in MI HSPCs after in vitro treatment with at-RA or control (DMSO). The percentage of cells is shown. Depicted p values correspond to the percentage of non-divided cells. Ordinary two-way ANOVA. n = 3. e, 1st and 2nd plating of human MI HSPC CFU assay after in vitro treatment with at-RA or control (DMSO). Unpaired t-test. n = 6. f, Volcano plots of DEGs between at-RA and DMSO (Ctrl) treatment in human BM HSPCs from healthy donors. DEGs that are common in previously published at-RA and DMSO (Ctrl) treatment in mouse BM HSCs (log2FC threshold = 0.5, P.adj < 0.1) are coloured in red (upregulated) or green (downregulated). 54 out of 313 upregulated human genes were conserved in mouse (17 %), while 78 out of 399 genes (20 %) were downregulated in both species. Important genes are annotated. g, GSEA of mouse RA direct target gene list in human HSPCs upon at-RA treatment vs. control (DMSO) from healthy donors based on population RNA-seq. h, Representative gating scheme for flow cytometric analysis of monocyte subtypes in PB of healthy donors. i, PCA of human PB monocytes from healthy donors upon control (DMSO), at-RA or 4-oxo-RA treatments based on the top 500 most variable genes in RNA-seq. n = 4. Data are presented as mean ± standard deviation. n indicates the number of biological replicates per condition or total number of human BM donors. For (d and e), three or more independent experiments were performed. Source data

References

    1. Yeh, R. W. et al. Population trends in the incidence and outcomes of acute myocardial infarction. New Engl. J. Med.362, 2155–2165 (2010). - PubMed
    1. Nahrendorf, M., Abbate, A. & Narula, J. Deciphering post-infarct inflammation: should it heal, would it hurt? J. Nucl. Cardiol.27, 2100–2102 (2020). - PubMed
    1. Nahrendorf, M., Pittet, M. J. & Swirski, F. K. Monocytes: protagonists of infarct inflammation and repair after myocardial infarction. Circulation121, 2437–2445 (2010). - PMC - PubMed
    1. Zouggari, Y. et al. B lymphocytes trigger monocyte mobilization and impair heart function after acute myocardial infarction. Nat. Med.19, 1273–1280 (2013). - PMC - PubMed
    1. Dutta, P. et al. E-selectin inhibition mitigates splenic HSC activation and myelopoiesis in hypercholesterolemic mice with myocardial infarction. Arterioscler. Thromb. Vasc. Biol.36, 1802–1808 (2016). - PMC - PubMed

Publication types

MeSH terms

LinkOut - more resources