. 2025 Apr 2;24(1):153.
doi: 10.1186/s12933-025-02711-x.

Improved prediction and risk stratification of major adverse cardiovascular events using an explainable machine learning approach combining plasma biomarkers and traditional risk factors

Affiliations

Improved prediction and risk stratification of major adverse cardiovascular events using an explainable machine learning approach combining plasma biomarkers and traditional risk factors

Xi-Ru Zhang et al. Cardiovasc Diabetol. .

Abstract

Background: Cardiovascular diseases (CVD) remain the leading cause of morbidity and mortality globally. Traditional risk models, primarily based on established risk factors, often lack the precision needed to accurately predict new-onset major adverse cardiovascular events (MACE). This study aimed to improve prediction and risk stratification by integrating traditional risk factors with biochemical and metabolomic biomarkers.

Methods: We analyzed data from 229,352 participants in the UK Biobank (median age 58.0 years; 45.4% male) who were free of baseline MACE. Biomarker selection was conducted using area under the curve (AUC), minimal joint mutual information maximization (JMIM), and correlation analyses, while Cox proportional hazards models were employed to evaluate the predictive performance of combined traditional risk factors and biomarkers. Optimal binary thresholds were determined utilizing CatBoost and SHAP, leading to the calculation of a Biomarker Risk Score (BRS) for each participant. Multivariable Cox models were conducted to assess the associations of each concerned biomarker and BRS with new-onset endpoints.

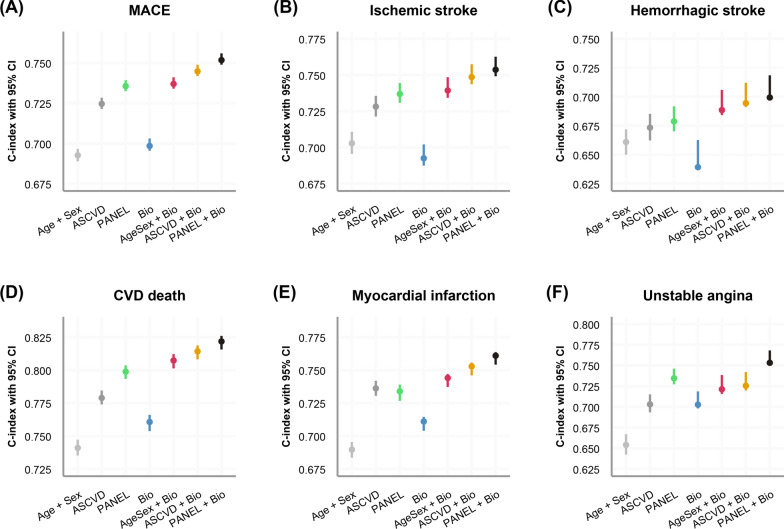
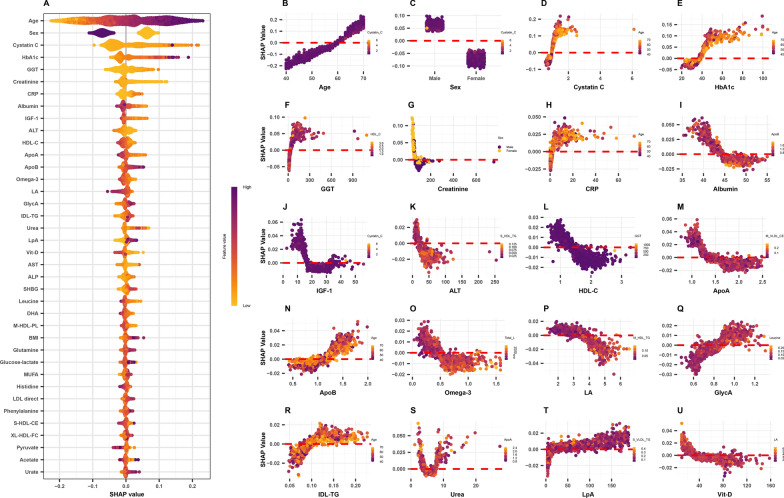
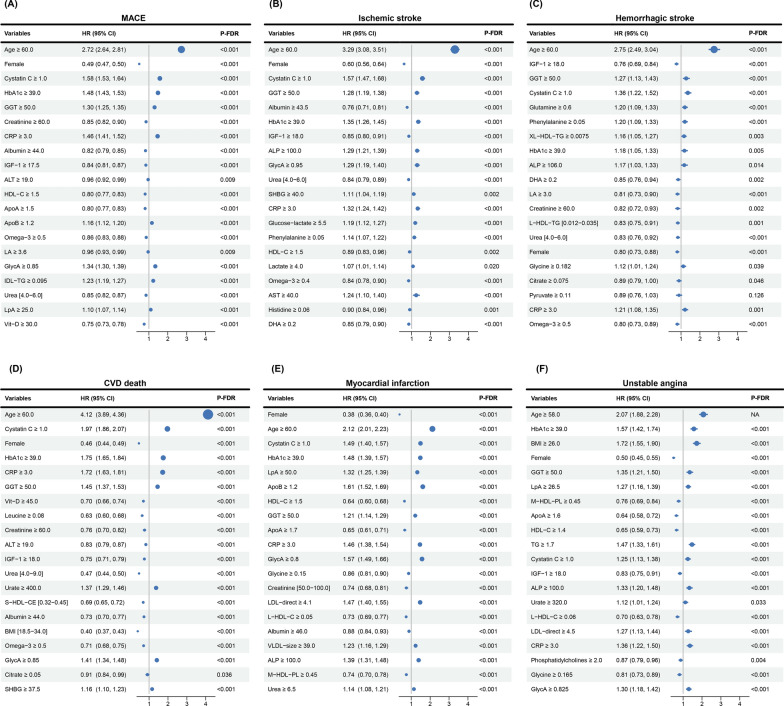
Results: The combination of PANEL + All Biochemistry + Cor0.95 of Nonov Met predictors demonstrated significantly improved discriminative performance compared to traditional models, such as Age + Sex and ASCVD, across all endpoints. Although the prediction for hemorrhagic stroke was suboptimal (C-index = 0.699), C-index values for other outcomes surpassed 0.75, with the highest value (0.822) recorded for CVD-related mortality. Key predictors of new-onset MACE included cystatin C, HbA1c, GlycA, and GGT, while IGF-1 and DHA exhibited potential protective effects. The BRS stratified individuals into low-, intermediate-, and high-risk groups, with the strongest effect observed for CVD death, where the high-risk group had a relative risk of 2.76 (95% CI 2.48-3.07) compared to the low-risk group.

Conclusion: Integrating traditional risk factors and biomarkers improves prediction and risk stratification of new-onset MACE. The BRS shows promise as a tool for identifying high-risk individuals, with the potential to support personalized CVD prevention and management strategies.

Keywords: Binary threshold; Biomarker risk score; Cardiovascular research; Major adverse cardiovascular events; Risk stratification.


Conflict of interest statement

Declarations. Ethics approval and consent to participate: This research complied with the principles of the Declaration of Helsinki. Written informed consent was obtained from all participants prior to their involvement, and ethical approval was granted by the North West Multi-Center Research Ethics Committee (reference: 11/NW/0382; https://www.ukbiobank.ac.uk/learn-more-about-ukbiobank/about-us/ethics ). Any additional ethical approval was adjudged unnecessary for the present study. Patient and public involvement: Patients and/or the public were not involved in the design, conduct, reporting or dissemination plans of this research. Patient consent for publication: Not required. Competing interests: The authors declare no competing interests.

Figures

Fig. 1
Fig. 1
Study overview. ASCVD: Age, Sex, Smoking, T2DM, SBP, TC, HDL-C; PANEL: Age, Sex, Education, Income, Ethnicity, BMI, Smoking status, Alcohol intake, Physical activity, Fruit consumption, Vegetable consumption, Sleep duration, Waist circumference, Hip circumference, CVD family history, SBP, DBP, T2DM, Hypertension, Blood pressure medication, Insulin, Cholesterol lowering medication. NMR nuclear magnetic resonance, MACE major adverse cardiovascular events, BMI body mass index, SHAP SHapley Additive exPlanations, BRI biomarker risk index, BRS biomarker risk score, SD standard deviation, CVD cardiovascular disease, TC total cholesterol, HDL-C HDL cholesterol, SBP systolic blood pressure, DBP diastolic blood pressure, T2DM type 2 diabetes mellitus, Bioche biochemical markers, Met metabolic markers, Nonov Met high-throughput nuclear magnetic resonance (NMR) metabolic markers, excluding those that overlap with clinical biochemical markers, AUC receiver operating characteristic curve, JMIM minimal joint mutual information maximization, Cor0.95 Spearman correlation coefficients less than 0.95, Bio a total of 26 biochemical markers combined with Cor0.95 of Nonov Met
Fig. 2
Fig. 2
Superior performance of combined biomarkers in cardiovascular risk stratification. This figure illustrates the comparative discriminative performance of incident MACE and its individual components, as assessed using Cox proportional hazards models. These models were developed based on selected biomarkers and three clinical predictor sets (Age + Sex, ASCVD, and PANEL) and their combinations. MACE major adverse cardiovascular events, CVD cardiovascular disease, CI confidence interval, Bio a set of 26 biochemical markers combined with Cor0.95 of Nonov Met, Cor0.95 Spearman correlation coefficients less than 0.95, Nonov Met, high-throughput nuclear magnetic resonance (NMR) metabolic markers, excluding those that overlap with clinical biochemical markers
Fig. 3
Fig. 3
SHAP analysis reveals key factors influencing the prediction of MACE (A). SHAP importance plot for the top 50% features in onset MACE prediction; (BU). SHAP dependence plot for top 20 features in onset MACE prediction. MACE major adverse cardiovascular events, SHAP SHapley Additive exPlanations
Fig. 4
Fig. 4
Cox proportional hazards model identifies key biomarkers associated with new-onset MACE and its components. MACE major adverse cardiovascular events, CVD cardiovascular disease, CI confidence interval, SD standard deviation, GGT gamma-glutamyltransferase, HbA1c glycated hemoglobin, CRP c-reactive protein, GlycA glycoprotein acetyls, HDL-C HDL cholesterol, ALP alkaline phosphatase, M-HDL-PL phospholipids in medium HD, DHA docosahexaenoic acid. Note: Cox proportional hazards regression adjusted for age, sex and body mass index
Fig. 5
Fig. 5
Elevated biomarkers and their association with incident MACE and cardiovascular outcomes. The HR and 95% CI for the association between the elevated biomarkers and new-onset MACE (A), ischemic stroke (B), hemorrhagic stroke (C), CVD mortality (D), myocardial infarction (E), and unstable angina (F). MACE major adverse cardiovascular events, CVD cardiovascular disease, HR hazard ratio, CI confidence interval. Note: Cox proportional hazards regression adjusted for age, sex and body mass index
Fig. 6
Fig. 6
Enhanced cardiovascular risk stratification using baseline risk index and biomarker risk score. (A). Cumulative risk of incident MACE and its components during follow-up, stratified by biomarker risk index; (B). Estimation of absolute and relative risk for new-onset MACE and its components, stratified by biomarker risk score, using the multivariable-adjusted Cox proportional hazards model. MACE major adverse cardiovascular events, CVD cardiovascular disease, BRS biomarker risk score, HR hazard ratio, CI confidence interval, ID incidence density. Notes The number of new-onset cases and the incidence proportion were presented as No. of cases (%); ID are provided per 1000 person-years; Cox proportional hazards regression adjusted for age, sex, education, average household income, ethnicity, smoke status, drinking frequency, met minutes for moderate activity per week, total fruit intake, total vegetable consumption, systolic blood pressure, diastolic blood pressure, blood pressure medication, insulin, cholesterol lowering medication, a family history of cardiovascular disease, prevalent type 2 diabetes mellitus, and prevalent hypertension

References

    1. Timmis A, Aboyans V, Vardas P, Townsend N, Torbica A, Kavousi M, et al. European Society of Cardiology: the 2023 Atlas of Cardiovascular Disease Statistics. Eur Heart J. 2024;45:4019–62. - PubMed
    1. Joynt Maddox KE, Elkind MSV, Aparicio HJ, Commodore-Mensah Y, de Ferranti SD, Dowd WN, et al. Forecasting the burden of cardiovascular disease and stroke in the United States through 2050-prevalence of risk factors and disease: a presidential advisory from the American Heart Association. Circulation. 2024;150:e65-88. - PubMed
    1. Buergel T, Steinfeldt J, Ruyoga G, Pietzner M, Bizzarri D, Vojinovic D, et al. Metabolomic profiles predict individual multidisease outcomes. Nat Med. 2022;28:2309–20. - PMC - PubMed
    1. SCORE2 working group and ESC Cardiovascular risk collaboration. SCORE2 risk prediction algorithms: new models to estimate 10-year risk of cardiovascular disease in Europe. Eur Heart J. 2021;42:2439–54. - PMC - PubMed
    1. Goff DC, Lloyd-Jones DM, Bennett G, Coady S, D’Agostino RB, Gibbons R, et al. 2013 ACC/AHA guideline on the assessment of cardiovascular risk: a report of the American College of Cardiology/American Heart Association Task Force on Practice Guidelines. J Am Coll Cardiol. 2014;63:2935–59. - PMC - PubMed

LinkOut - more resources