

Caffeic acid and chlorogenic acid mediate the ADPN-AMPK-PPARα pathway to improve fatty liver and production performance in laying hens
- PMID: 40176148
- PMCID: PMC11966898
- DOI: 10.1186/s40104-025-01175-z
Caffeic acid and chlorogenic acid mediate the ADPN-AMPK-PPARα pathway to improve fatty liver and production performance in laying hens
Abstract
Background: Caffeic acid (CA) and its derivative, chlorogenic acid (CGA), have shown promise in preventing and alleviating fatty liver disease. CA, compared to CGA, has much lower production costs and higher bioavailability, making it a potentially superior feed additive. However, the efficacy, mechanistic differences, and comparative impacts of CA and CGA on fatty liver disease in laying hens remain unclear. This study aimed to evaluate and compare the effects of CA and CGA on production performance, egg quality, and fatty liver disease in laying hens.
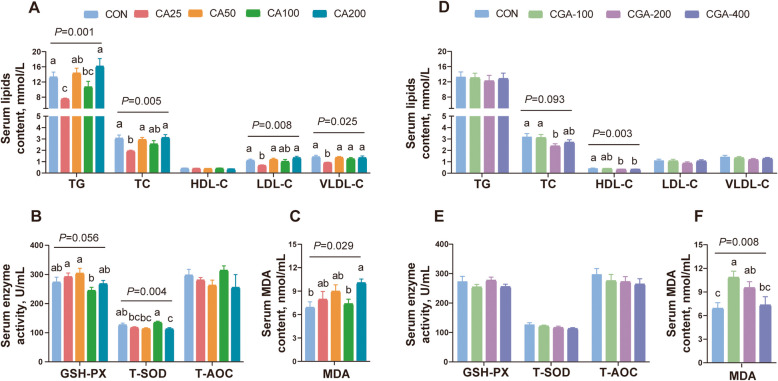
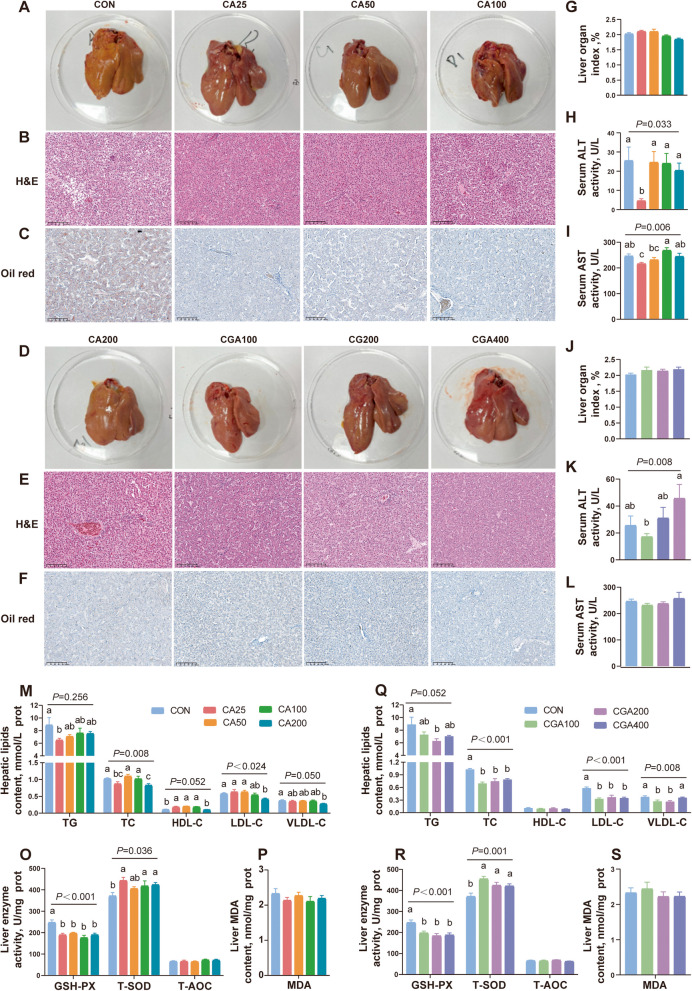
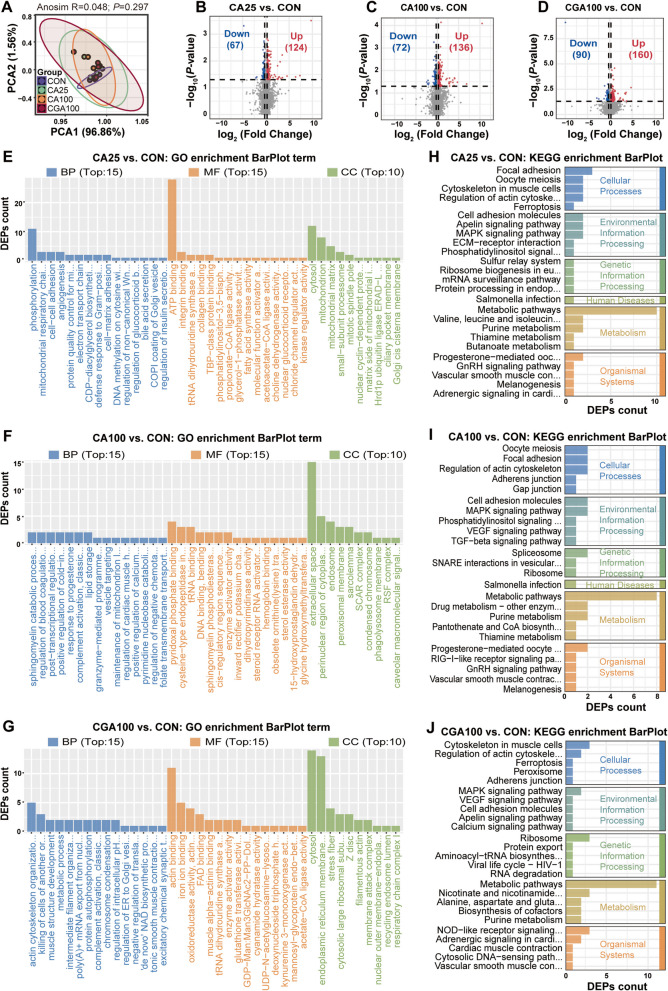
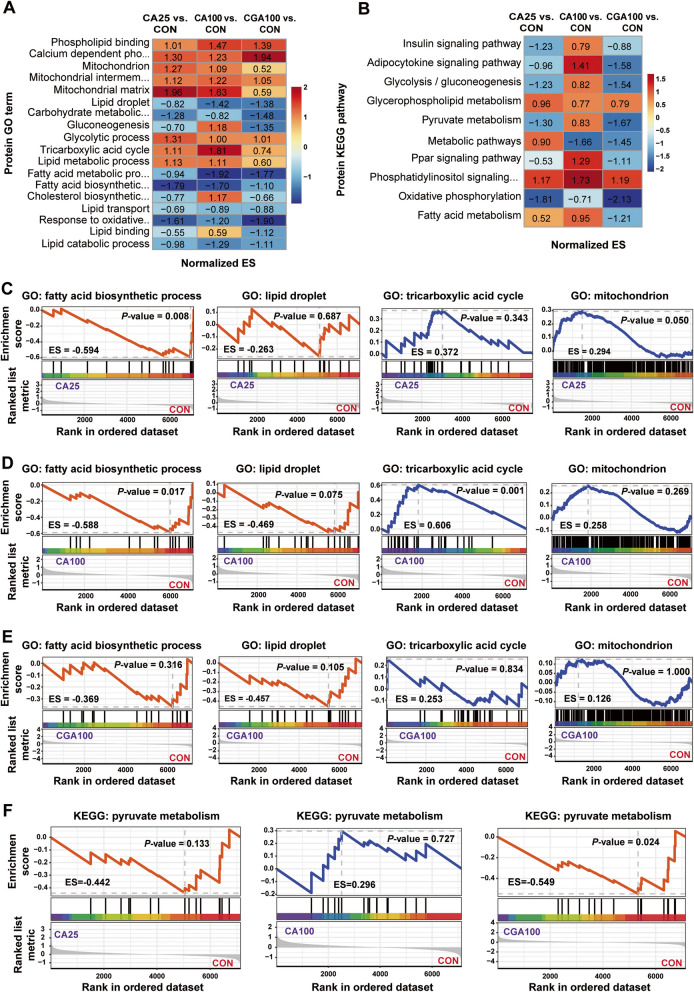
Results: A total of 1,440 61-week-old Hyline Brown laying hens were randomly divided into 8 groups and fed diets supplemented with basal diet, 25, 50, 100 and 200 mg/kg of CA, and 100, 200 and 400 mg/kg of CGA (CON, CA25, CA50, CA100, CA200, CGA100, CGA200 and CGA400, respectively) for 12 weeks. Both CA and CGA improved production performance and egg quality, while reducing markers of hepatic damage and lipid accumulation. CA and CGA significantly decreased TG, TC, and LDL-C levels and increased T-SOD activity. Transcriptomic and proteomic analyses revealed that CA and CGA reduced hepatic lipid accumulation through downregulation of lipid biosynthesis-related genes (ACLY, ACACA, FASN, and SCD1) and enhanced lipid transport and oxidation genes (FABPs, CD36, CPT1A, ACOX1, and SCP2). Of note, low-dose CA25 exhibited equivalent efficacy to the higher dose CGA100 group in alleviating fatty liver conditions. Mechanistically, CA and CGA alleviated lipid accumulation via activation of the ADPN-AMPK-PPARα signaling pathway.
Conclusions: This study demonstrates that dietary CA and CGA effectively improve laying performance, egg quality, and hepatic lipid metabolism in laying hens, with CA potentially being more economical and efficient. Transcriptomic and proteomic evidence highlight shared mechanisms between CA25 and CGA100. These findings provide a foundation for CA and CGA as therapeutic agents for fatty liver disease and related metabolic diseases in hens, and also offer insights into the targeted modification of CGA (including the isomer of CGA) into CA, thereby providing novel strategies for the efficient utilization of CGA.
Keywords: Absorptivity; Caffeic acid; Chlorogenic acid; Fatty liver; Laying hens.
© 2025. The Author(s).
Conflict of interest statement
Declarations. Ethics approval and consent to participate: All experimental procedures were reviewed and approved by the Experimental Animal Welfare and Ethical Board of the Institute of Animal Science (IAS), Chinese Academy of Agricultural Sciences (CAAS), Beijing, China (Approval number: IAS2023-114). Consent for publication: All of the authors have approved the final version of the manuscript and agreed with this submission to the Journal of Animal Science and Biotechnology. Competing interests: The authors declare that they have no competing interests.
Figures


References
-
- Arulnathan V, Turner I, Bamber N, Ferdous J, Grassauer F, Doyon M, et al. A systematic review of potential productivity, egg quality, and animal welfare implications of extended lay cycles in commercial laying hens in Canada. Poult Sci. 2024;103(4):103475. 10.1016/j.psj.2024.103475. - DOI - PMC - PubMed
Grants and funding
- 2023YFD1301200/National Key R&D Program of China
- CARS-40-K11/China Agriculture Research Systems
- BAIC06-2024-G05/Beijing Agriculture Innovation Consortium
- NCTIP-XD/C08/Strategic Priority Research Program of the National Center of Technology Innovation for Pigs
- ASTIP-IAS-12/The Chinese Academy of Agricultural Science and Technology Innovation Project
LinkOut - more resources
Full Text Sources
Research Materials
Miscellaneous
