. 2025 Apr 15;19(14):13685-13704.
doi: 10.1021/acsnano.4c14625. Epub 2025 Apr 2.

Peptide-Modified Lipid Nanoparticles Boost the Antitumor Efficacy of RNA Therapeutics

Affiliations

Peptide-Modified Lipid Nanoparticles Boost the Antitumor Efficacy of RNA Therapeutics

Gangyin Zhao et al. ACS Nano. .

Abstract

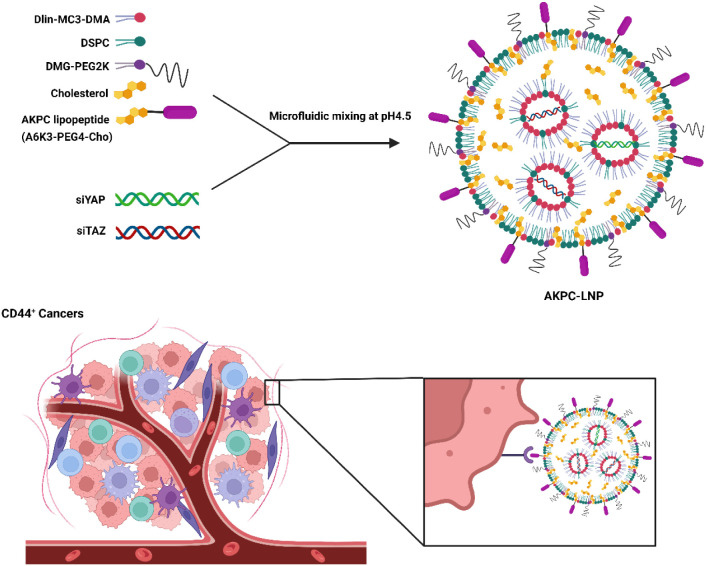
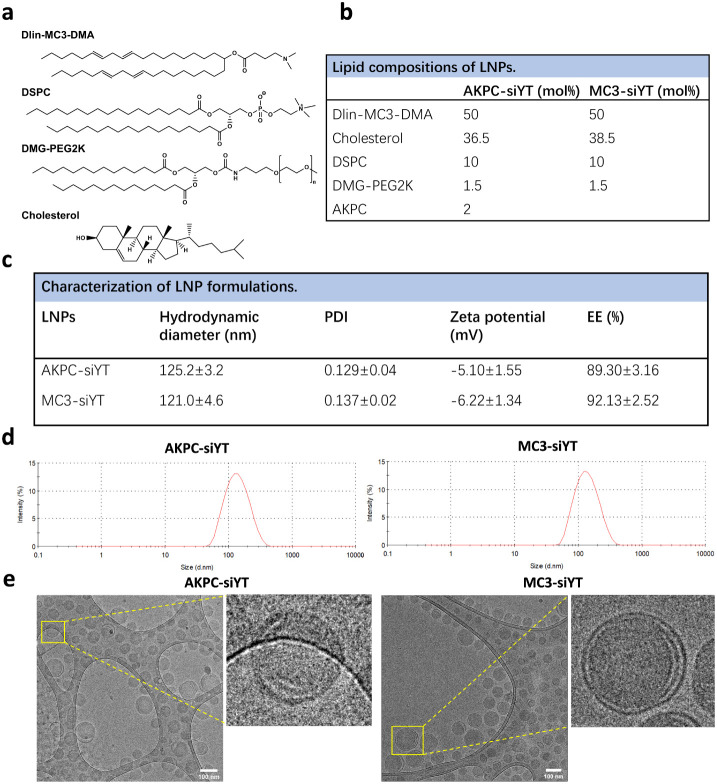
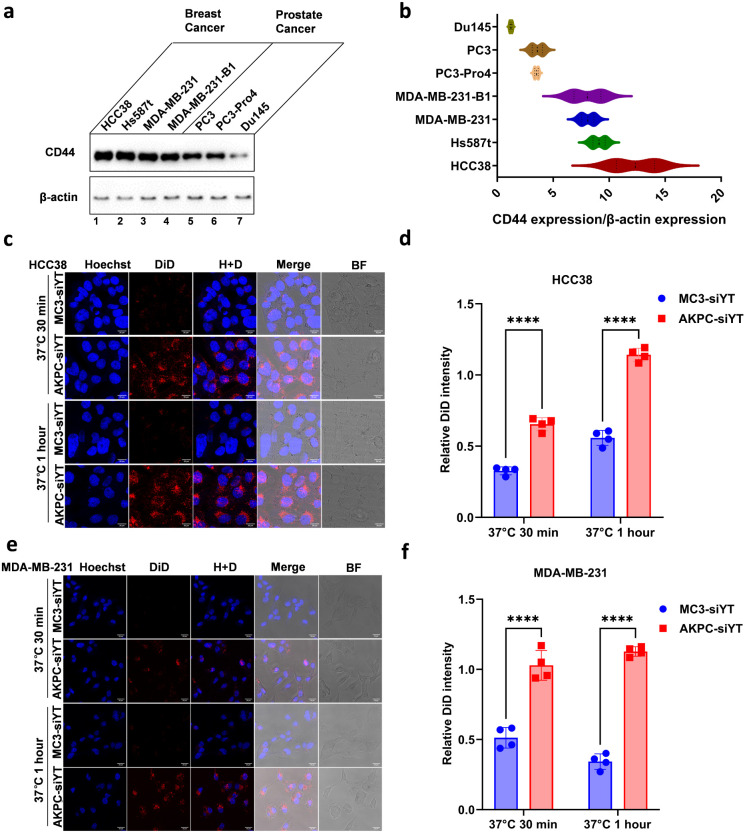
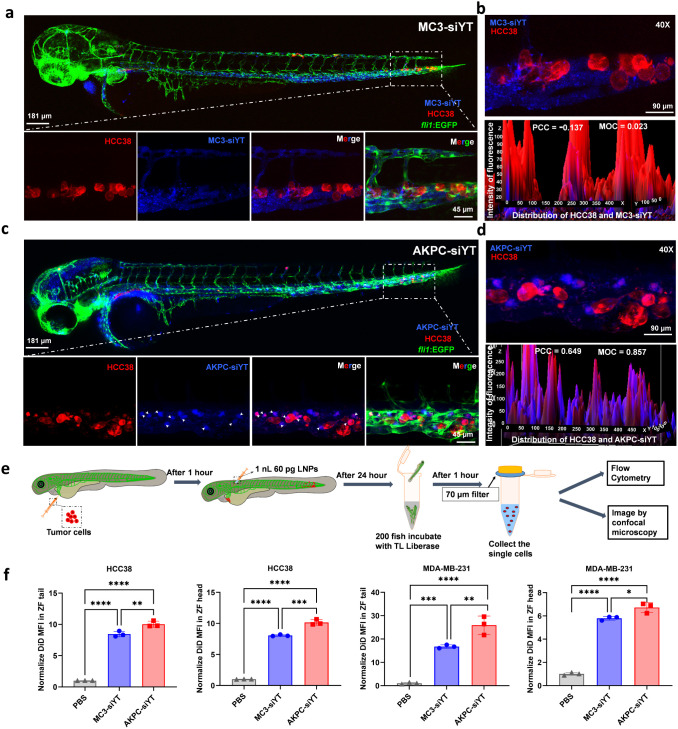
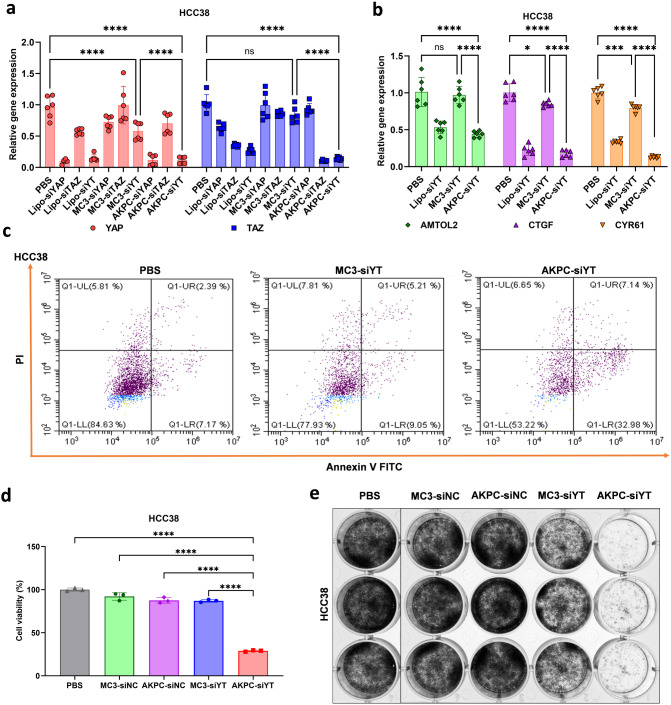
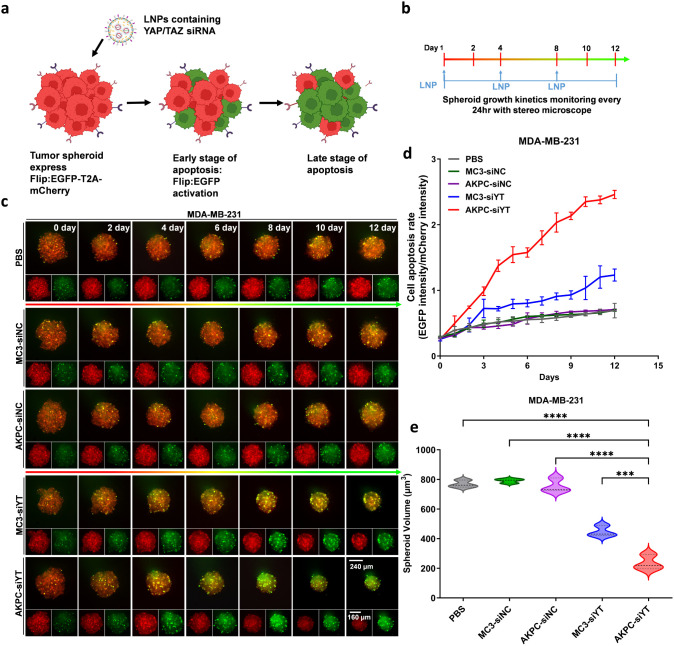
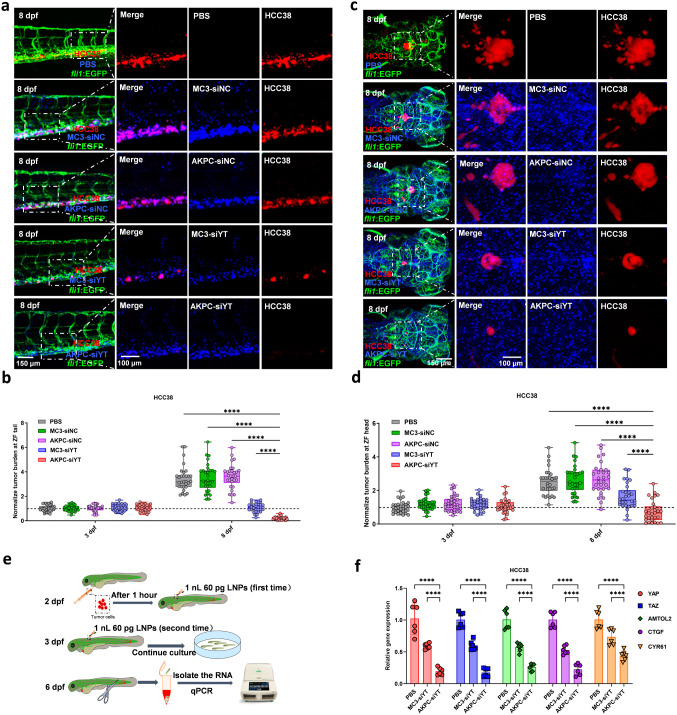
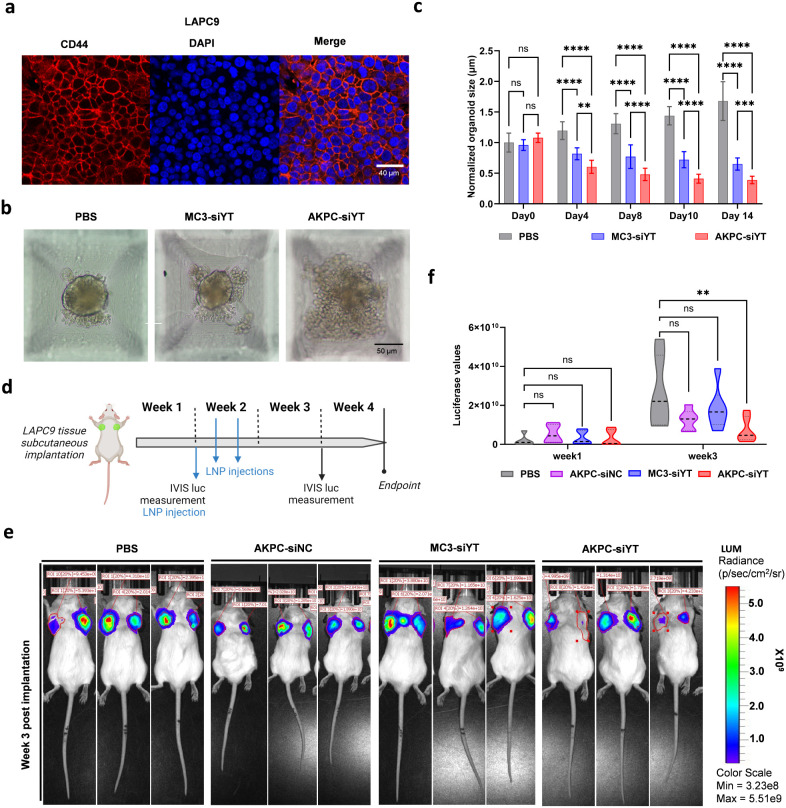
RNA therapeutics offer a promising approach to cancer treatment by precisely regulating cancer-related genes. While lipid nanoparticles (LNPs) are currently the most advanced nonviral clinically approved vectors for RNA therapeutics, their antitumor efficacy is limited by their unspecific hepatic accumulation after systemic administration. Thus, there is an urgent need to enhance the delivery efficiency of LNPs to target tumor-residing tissues. Here, we conjugated the cluster of differentiation 44 (CD44)-specific targeting peptide A6 (KPSSPPEE) to the cholesterol of LNPs via PEG, named AKPC-LNP, enabling specific tumor delivery. This modification significantly improved delivery to breast cancer cells both in vitro and in vivo, as shown by flow cytometry and confocal microscopy. We further used AKPC-siYT to codeliver siRNAs targeting the transcriptional coactivators YAP and TAZ, achieving potent gene silencing and increased cell death in both 2D cultures and 3D tumor spheroids, outperforming unmodified LNPs. In a breast tumor cell xenografted zebrafish model, systemically administered AKPC-siYT induced robust silencing of YAP/TAZ and downstream genes and significantly enhanced tumor suppression compared to unmodified LNPs. Additionally, AKPC-siYT effectively reduced proliferation in prostate cancer organoids and tumor growth in a patient-derived xenograft (PDX) model. Overall, we developed highly efficient AKPC-LNPs carrying RNA therapeutics for targeted cancer therapy.

Keywords: CD44; YAP/TAZ siRNA; lipid nanoparticles; patient-derived PDX; tumor targeting; zebrafish.


Conflict of interest statement

The authors declare no competing financial interest.

Figures

Scheme 1
Scheme 1. Schematic Representation of Therapeutic Gene Silencing Using LNPs Modified with CD44 Targeted Peptides for YAP/TAZ-siRNA Delivery to CD44+ Cancer Cells
Figure 1
Figure 1
Design and characterization of CD44-specific peptide -modified LNP. a, Lipid structures used for the preparation of LNPs. b, Lipid compositions of LNPs in molar ratio (mol %). c, Characterizations of LNPs. d, Representative DLS measurements of LNPs. (e) Cryo-TEM images of LNPs. LNPs were encapsulated with nonsense siRNA. Scale bar: 100 nm.
Figure 2
Figure 2
Evaluation of AKPC-siYT targeting breast cancer cells in vitro. a, Western blot images of CD44 expression in different cell lines. CD44 and β-actin mouse primary antibodies were used to detect protein expression. b, Quantification of CD44 expression to β-actin in different cell lines. c,e, Confocal microscopic images of cellular internalization of LNPs in HCC38 and MDA-MB-231 cells at 37 °C after 30 min and 1 h of incubation. 0.5 mol % DiD was added to the lipids and served as the fluorescent dye. Scale bar represents 20 μm. d,f, The DiD fluorescence intensity was normalized to Hoechst for the uptake quantification of LNPs by HCC38 and MDA-MB-231 cells. A two-way ANOVA multiple comparison was used to determine the significance of data indicated in d and f (*p < 0.05; **p < 0.01; ***p < 0.001; ****p < 0.0001). In all panels, error bars represent mean ± s.d. (n = 3).
Figure 3
Figure 3
In vivo tumor targeting of LNPs to HCC38 cells in zebrafish. a,c, HCC38 cells (in red), stably expressing mCherry, were implanted into the circulation of 2 dpf fli1/EGFP (in green) zebrafish. One hour later, 0.2 mol % DiD (far-red fluorescence) labeled LNPs (1 nL, 60 pg siRNA) (in blue) were injected into the circulation of zebrafish by DoC. SP8 Confocal measured the tumor targeting of LNPs to tumor cells in the zebrafish circulatory system 4 h after LNP injection. b,d, Colocalization of HCC38 and LNPs in the circulation of zebrafish. ImageJ was used to analyze the distribution of LNPs in the cell area, and the cell fluorescence intensity and LNP fluorescence intensity in the cell area were calculated at the same time. PCC (Pearson correlation coefficient): 1 indicates perfect correlation; 0 indicates random distribution; −1 indicates that colocalization is completely excluded. MOC (Manders overlap coefficient): the value can be 0–1, where 1 indicates complete overlap and 0 indicates complete separation.e, Schematic diagram of the isolation of tumor cells from zebrafish. f, Flow cytometry analysis of LNPs uptake in HCC38 and MDA-MB-231 transplanted in the zebrafish tail and head. The DiD mean fluorescence intensity was normalized to the PBS group for the quantification of LNPs uptake by HCC38 and MDA-MB-231 cells. An ordinary one-way ANOVA multiple comparison was used to determine the significance of data indicated in f (*p < 0.05; **p < 0.01; ***p < 0.001; ****p < 0.0001). In all panels, error bars represent mean ± s.d. (n = 3).
Figure 4
Figure 4
In vitro antitumor effects of AKPC-siYT on 2D cells. a, RT-PCR results after codelivery of siYAP and siTAZ to HCC38 cells. PBS (negative control); Lipo-siYAP, -siTAZ, -siYT (positive control): lipofectamine containing siYAP, siTAZ, siYAP, and a siTAZ mixture; MC3-siYAP, -siTAZ, -siYT: MC3-LNP containing YAP siRNA, TAZ siRNA, and a YAP and TAZ siRNA mixture; AKPC-siYAP, -siTAZ, -siYT: AKPC-LNPs containing YAP siRNA, TAZ siRNA, a YAP and TAZ siRNA mixture. The concentrations of siRNAs were constant for all conditions (siRNA, 2 μg/mL). b, RT-PCR results of the downstream gene after codelivery of siYAP and siTAZ to HCC38 cells. Two-way ANOVA was used to determine the significance of the comparisons of data indicated in a, b (*p < 0.05; **p < 0.01; ***p < 0.001; ****p < 0.0001). In all panels, error bars represent mean ± s.d. (n = 3) c, Annexin V/PI staining of HCC38 cells after treatments with PBS and LNPs. d, Cell viability measurements by WST-1 in HCC38 cells after treatments with LNPs. Ordinary one-way ANOVA was used to determine the significance of the comparisons of data (*p < 0.05; **p < 0.01; ***p < 0.001; ****p < 0.0001). In all panels, error bars represent mean ± s.d. (n = 3). e, 1000 cells were seeded as single cells in six-well plate, cultured continuously for 12 days, and treated with LNPs on days 1, 4, and 8 (siRNA, 2 μg/mL). Crystal Violet was used to stain cells and count the number of cell colonies on day 12, indicating the proliferation capacity of the cells.
Figure 5
Figure 5
Antitumor effect of AKPC-siYT in 3D tumor spheroids of MDA-MB-231. a, Schematic representation of the plasmid containing EGFP-T2A-Caspase3-mCherry (cell apoptosis sensor). b, Schematic representation of seeding and treatment of spheroids to monitor spheroid growth kinetics. On days 1, 4, and 8, LNPs were used to treat MDA-MB-231-derived spheroids in different groups (siRNA, 2 μg/mL). A stereo microscope was used to record the tumor spheroids each day for 12 consecutive days. c, Images of representative MDA-MB-231 spheroids over time after treatments with LNPs (MC3-siNC/AKPC-siNC: LNPs contain a negative control of siRNA; MC3-siYT/AKPC-siYT: LNPs contain a siYAP and siTAZ mixture), Flip:EGFP intensity (in green) represents cell apoptosis. d, Kinetics of the cell apoptosis rate (EGFP intensity/mCherry intensity) from MDA-MB-231 spheroids over time after treatments with LNPs. e, MDA-MB-231 spheroids volume calculated by image J on day 12. Ordinary one-way ANOVA was used to determine the significance of the comparisons of data (*p < 0.05; **p < 0.01; ***p < 0.001; ****p < 0.0001). In all panels, error bars represent mean ± s.d. (n = 3).
Figure 6
Figure 6
Therapeutic antitumor effect of AKPC-siYT in vivo on HCC38 xenografts. a, Confocal image of HCC38-mCherry tumor burden (in red) with LNPs-siRNA (in blue) in the circulation of zebrafish at 8 dpf. Green represents vessels of zebrafish embryos. b, The relative intensity of red fluorescence (the ratio of fluorescence intensity of each group at 8 dpf to that of the PBS group at 3 dpf) was used to measure tumor burden at CHT sites of zebrafish at 3 dpf and 8 dpf (n = 30/group). c, Confocal image of HCC38 tumor burden with LNPs-siRNA in the hindbrain at 8 dpf. d, The relative intensity of red fluorescence (the ratio of fluorescence intensity of each group at 8 dpf to that of the PBS group at 3 dpf) was used to measure tumor burden in the hindbrain of zebrafish at 3 and 8 dpf (n = 30/group). Two-way ANOVA multiple comparisons were used to determine the significance of the comparisons of data indicated in b and d (*p < 0.05; **p < 0.01; ***p < 0.001; ****p < 0.0001). In all panels, error bars represent mean ± s.d. e, Schematic representation of RNA isolation of tumor cells from the tail of zebrafish and RT-PCR detection. f, RT-PCR results of YAP/TAZ and downstream gene expression in zebrafish after codelivery of siYAP and siTAZ at 8 dpf. Two-way ANOVA was used to determine the significance of the comparisons of data (*p < 0.05; **p < 0.01; ***p < 0.001; ****p < 0.0001). In all panels, error bars represent mean ± s.d. (n = 3).
Figure 7
Figure 7
Antitumor effect of AKPC-siYT on prostate cancer PDX-derived organoids and in vivo tumor growth. a, Prostate cancer PDX model (LAPC9) exhibited high CD44 protein levels (CD44 in red, nuclei marked by DAPI in blue) by immunofluorescence staining. b, Morphology of LAPC9 PDX-derived organoids following treatment with PBS, MC3-siYT, and AKPC-siYT (siRNA, 2 μg/mL) for 14 days. Scale bar, 50 μm. c, Organoid size of each treatment group (PBS, MC3-siYT, and AKPC-siYT) was measured at different time points (day 0, 4, 8, 10, and 14). Two-way ANOVA multiple comparison was used to determine the significance of the comparisons of data (*p < 0.05; **p < 0.01; ***p < 0.001; ****p < 0.0001). In all panels, error bars represent mean ± s.d. (n = 3) d, Schematic representation of in vivo tumor growth kinetics of LAPC9 PDX following LNP treatment. Bioluminescent LAPC9-copGFP-CBR tumor tissues were subcutaneously (s.c.) implanted in CB17 SCID mice at day 0. Following a lag period of 1 week, mice were subjected to one-week LNP treatment (Days 7, 9, and 11 of week 2). LNPs were sc injected at the tumor-adjacent area (siRNA, 10 μg/tumor, n = 3/group). Intravital imaging (IVIS-CT) was used to record tumor dynamics based on stable bioluminescence expression of the LAPC9 tumor cells weekly for 3 consecutive weeks. At the endpoint (week 4), IVIS-CT, tumor collection, and body weight measurement were done. e, Bioluminescence images of LAPC9 PDX tumors showing individual tumor areas (n = 3/LNP treatment group) at the endpoint. f, Violin plot of in vivo tumor growth based on average bioluminescence radiance of individual tumors at endpoint (day 28) (n = 3 animals/group × 2 tumors). Two-way ANOVA, ŠídÁk’s multiple comparisons test was used to determine the significance of the comparisons of data indicated in d (*p < 0.05; **p < 0.01; ***p < 0.001; ****p < 0.0001). In all panels, error bars represent mean ± s.d.

Similar articles

References

    1. Ji F.; Yang C.-Q.; Li X.-L.; Zhang L.-L.; Yang M.; Li J.-Q.; Gao H.-F.; Zhu T.; Cheng M.-Y.; Li W.-P.; et al. Risk of breast cancer-related death in women with a prior cancer. Aging 2020, 12 (7), 5894–5906. 10.18632/aging.102984. - DOI - PMC - PubMed
    1. Park M.; Kim D.; Ko S.; Kim A.; Mo K.; Yoon H. Breast cancer metastasis: mechanisms and therapeutic implications. Int. J. Mol. Sci. 2022, 23 (12), 6806.10.3390/ijms23126806. - DOI - PMC - PubMed
    1. Taskindoust M.; Thomas S. M.; Sammons S. L.; Fayanju O. M.; DiLalla G.; Hwang E. S.; Plichta J. K. Survival outcomes among patients with metastatic breast cancer: review of 47,000 patients. Ann. Surg. Oncol. 2021, 28 (12), 7441–7449. 10.1245/s10434-021-10227-3. - DOI - PMC - PubMed
    1. Rosenblum D.; Gutkin A.; Kedmi R.; Ramishetti S.; Veiga N.; Jacobi A. M.; Schubert M. S.; Friedmann-Morvinski D.; Cohen Z. R.; Behlke M. A.; et al. CRISPR-Cas9 genome editing using targeted lipid nanoparticles for cancer therapy. Sci. Adv. 2020, 6 (47), eabc945010.1126/sciadv.abc9450. - DOI - PMC - PubMed
    1. Sawyers C. Targeted cancer therapy. Nature 2004, 432 (7015), 294–297. 10.1038/nature03095. - DOI - PubMed

Publication types