

Breeding in winter wheat (Triticum aestivum L.) can be further progressed by targeting previously neglected competitive traits
- PMID: 40177013
- PMCID: PMC11961425
- DOI: 10.3389/fpls.2025.1490483
Breeding in winter wheat (Triticum aestivum L.) can be further progressed by targeting previously neglected competitive traits
Abstract
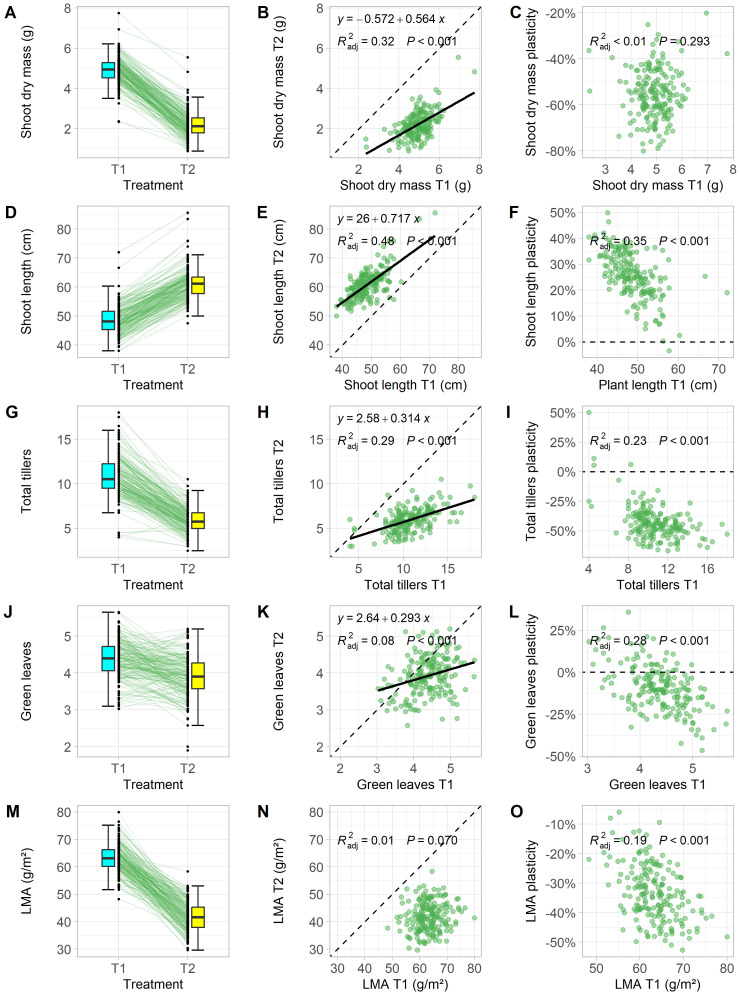
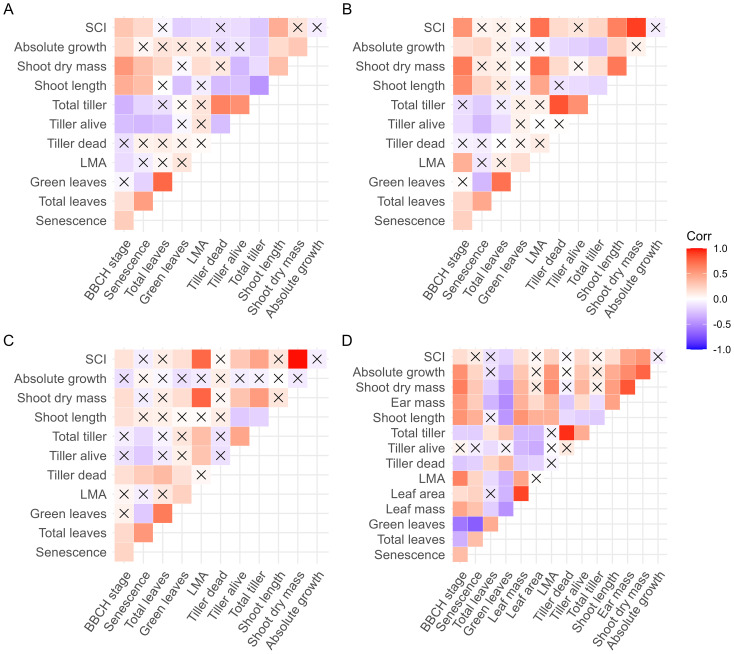
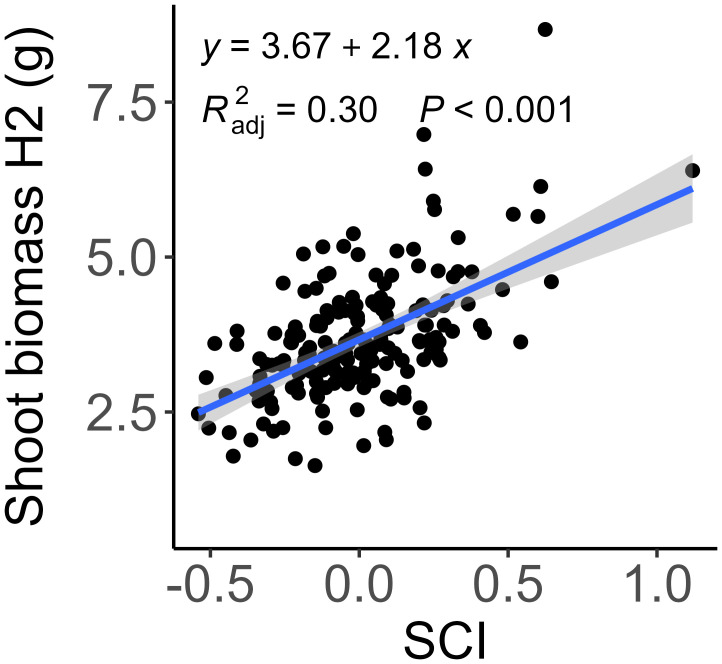
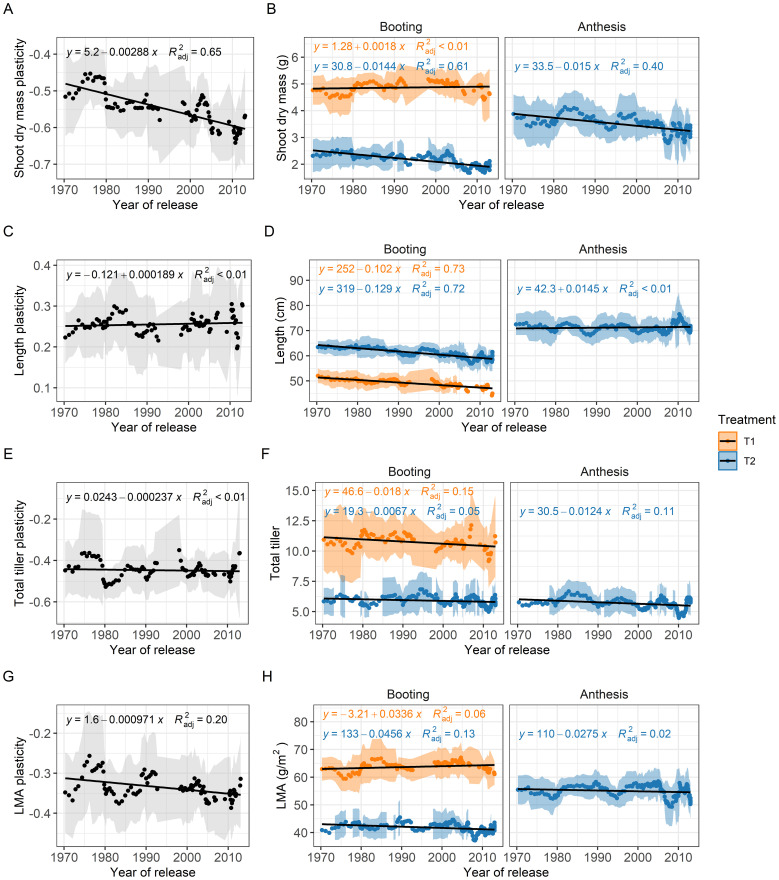
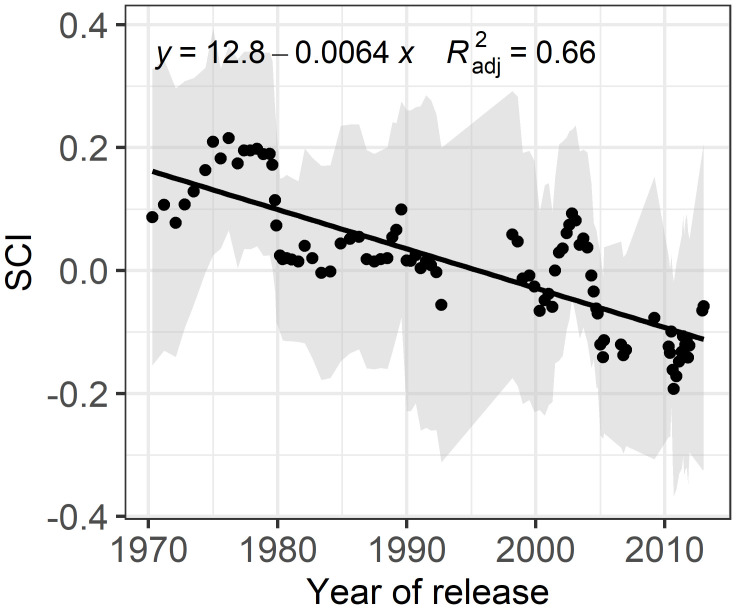
Breeders work to adapt winter wheat genotypes for high planting densities to pursue sustainable intensification and maximize canopy productivity. Although the effects of plant-plant competition at high planting density have been extensively reported, the quantitative relationship between competitiveness and plant performance remains unclear. In this study, we introduced a shoot competitiveness index (SCI) to quantify the competitiveness of genotypes and examined the dynamics of nine competitiveness-related traits in 200 winter wheat genotypes grown in heterogeneous canopies at two planting densities. Higher planting densities increased shoot length but reduced biomass, tiller numbers, and leaf mass per area (LMA), with trait plasticity showing at least 41% variation between genotypes. Surprisingly, genotypes with higher LMA at low density exhibited greater decreases under high density, challenging expectations from game theory. Regression analysis identified tiller number, LMA, and shoot length as key traits influencing performance under high density. Contrary to our hypothesis, early competitiveness did not guarantee sustained performance, revealing the dynamic nature of plant-plant competition. Our evaluation of breeding progress across the panel revealed a declining trend in SCI (R² = 0.61), aligning with the breeding objective of reducing plant height to reduce individual competitiveness and increase the plant-plant cooperation. The absence of historical trends in functional traits and their plasticities, such as tiller number and LMA, suggests their potential for designing ideal trait-plasticity for plant-plant cooperation and further crop improvement.
Keywords: breeding progress; canopy productivity; intergenotypic competition in plant; phenotypic plasticity; plant-plant competition; plant-plant interaction; planting density.
Copyright © 2025 Manntschke, Hempel, Temme, Reumann and Chen.
Conflict of interest statement
The authors declare that the research was conducted in the absence of any commercial or financial relationships that could be construed as a potential conflict of interest. The reviewer FB declared a shared affiliation with the author AT to the handling editor at the time of review.
Figures
Similar articles
-
Phenotypic Variation of the Invasive Plant Ageratum conyzoides and Analysis of Its Competitiveness With the Co-Occurring Indigenous Species Perilla frutescens.Ecol Evol. 2025 Jun 10;15(6):e71532. doi: 10.1002/ece3.71532. eCollection 2025 Jun. Ecol Evol. 2025. PMID: 40503077 Free PMC article.
-
Rooting for resilience: central metaxylem area as a breeding target for yield gain and resilience in wheat (Triticum aestivum L.).BMC Plant Biol. 2025 Apr 21;25(1):493. doi: 10.1186/s12870-025-06523-9. BMC Plant Biol. 2025. PMID: 40259220 Free PMC article.
-
Genetic improvement of important agronomic traits in Chinese wheat breeding over the past 70 years.BMC Plant Biol. 2024 Nov 29;24(1):1151. doi: 10.1186/s12870-024-05841-8. BMC Plant Biol. 2024. PMID: 39614144 Free PMC article.
-
Genomewide association study for seeding emergence and tiller number using SNP markers in an elite winter wheat population.J Genet. 2017 Mar;96(1):177-186. doi: 10.1007/s12041-016-0731-1. J Genet. 2017. PMID: 28360404 Review.
-
Breeding maize of ideal plant architecture for high-density planting tolerance through modulating shade avoidance response and beyond.J Integr Plant Biol. 2024 May;66(5):849-864. doi: 10.1111/jipb.13603. Epub 2024 Jan 29. J Integr Plant Biol. 2024. PMID: 38131117 Review.
Cited by
-
Species Interactions Shape Nitrogen Utilization Characteristics and Influence Soil Quality in Jujube-Alfalfa Intercropping System.Plants (Basel). 2025 Jul 3;14(13):2048. doi: 10.3390/plants14132048. Plants (Basel). 2025. PMID: 40648057 Free PMC article.
References
-
- Artzet S., Chen T.-W., Chopard J., Brichet N., Mielewczik M., Cohen-Boulakia S., et al. . (2019). Phenomenal: An automatic open source library for 3D shoot architecture reconstruction and analysis for image-based plant phenotyping. bioRxiv. 805739. doi: 10.1101/805739 - DOI
-
- Bastos L. M., Carciochi W., Lollato R. P., Jaenisch B. R., Rezende C. R., Schwalbert R., et al. . (2020). Winter wheat yield response to plant density as a function of yield environment and tillering potential: A review and field studies. Front. Plant Sci. 11. doi: 10.3389/fpls.2020.00054 - DOI - PMC - PubMed
-
- Bates D., Maechler M., Bolker B., Walker S. (2015). Fitting Linear Mixed-Effects Models Using lme4. J. Stat. Softw. 67 (1), 1–48. doi: 10.32614/CRAN.package.lme4 - DOI
-
- Beaugendre A., Mingeot D., Visser M. (2022). Complex plant interactions in heterogeneous material require the ecological rethinking of sowing density recommendations for bread wheat. A review. Agron. Sustain. Dev. 42, 9. doi: 10.1007/s13593-021-00735-7 - DOI
LinkOut - more resources
Full Text Sources