Dysregulation of bile acid signal transduction causes neurological dysfunction in cirrhosis rats
- PMID: 40177200
- PMCID: PMC11959655
- DOI: 10.4254/wjh.v17.i3.101340
Dysregulation of bile acid signal transduction causes neurological dysfunction in cirrhosis rats
Abstract
Background: The pathogenesis of hepatic encephalopathy (HE) remains unclear, and the classical theory of ammonia toxicity lacks sufficient justification.
Aim: To investigate the potential of bile acids as intervention targets for HE.
Methods: This study employed 42 wild-type male SD rats weighing 200 ± 20 g. Using a random number table method, two rats were randomly selected to undergo common bile duct ligation (BDL). The remaining 40 rats were randomly assigned to four groups serving as controls: The vehicle + control diet (VC) group, the thioacetamide (TAA) group, the TAA + total bile acids (TAAT) group, and the TAA + cholestyramine (TAAC) group. Except for the VC group, all rats were intraperitoneally injected with 100 mg/kg TAA solution once daily for ten consecutive days to establish a HE model. Simultaneously, the TAAT and TAAC groups were administered a diet containing 0.3% bile acids (derived from BDL rats) and 2% cholestyramine, respectively, by gavage for ten days. For the BDL rat model group, the common BDL procedure was performed following the aforementioned protocol. After four weeks, laparotomy revealed swollen bile ducts at the ligation site, and bile was collected. Following successful modeling, behavioral tests, including the elevated plus maze and open field test, were conducted to assess the HE status of the rats. Peripheral blood, liver, and cerebral cortex tissue samples were collected, and the total bile acid content in the serum and cerebral cortex was measured using an enzyme cycling method. The levels of inflammatory factors in the serum and cerebral cortex were analyzed using enzyme-linked immunosorbent assay. Liver histological examination was performed using the hematoxylin-eosin double-labeling method. Reverse transcription polymerase chain reaction, western blot, immunohistochemistry, and other techniques were employed to observe the expression of microglial activation marker ionized calcium-binding adaptor molecule-1 and Takeda G protein-coupled receptor 5 (TGR5) protein.
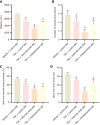
Results: Compared to the VC group, the TAA group exhibited an exacerbation of HE in rats. The total bile acid content, pro-inflammatory factors [interleukin-1β (IL-1β), IL-6], and the anti-inflammatory factor IL-10 in both the serum and cerebral cortex were significantly elevated. Similarly, the expression of the TGR5 receptor in the cerebral cortex was upregulated. To investigate the impact of total bile acids on HE in rats, comparisons were made with the TAA group. In the TAAT group, the severity of HE was further aggravated, accompanied by increased total bile acid content in the serum and cerebral cortex, elevated pro-inflammatory factors (IL-1β, IL-6), reduced levels of the anti-inflammatory factor IL-10, and decreased expression of the TGR5 receptor in the cerebral cortex. In the TAAC group, the severity of HE was alleviated. This group showed reductions in total bile acid content in the serum and cerebral cortex, decreased pro-inflammatory factors (IL-1β, IL-6), increased levels of the anti-inflammatory factor IL-10, and enhanced expression of the TGR5 receptor in the cerebral cortex.
Conclusion: This study demonstrated that the total bile acid content in the serum and cerebral cortex of TAA-induced liver cirrhosis rats was elevated. Furthermore, total bile acids exacerbate the progression of HE in rats. This effect may be attributed to bile acids' involvement in the development of neurological dysfunction by mediating TGR5 expression and regulating neuroinflammation.
Keywords: G protein-coupled bile acid receptor 1; Hepatic encephalopathy; Liver cirrhosis; Thioacetamide; Total bile acid.
©The Author(s) 2025. Published by Baishideng Publishing Group Inc. All rights reserved.
Conflict of interest statement
Conflict-of-interest statement: All the authors report no relevant conflicts of interest for this article.
Figures


References
-
- Bajaj JS, O'Leary JG, Tandon P, Wong F, Garcia-Tsao G, Kamath PS, Maliakkal B, Biggins SW, Thuluvath PJ, Fallon MB, Subramanian RM, Vargas HE, Lai J, Thacker LR, Reddy KR. Hepatic Encephalopathy Is Associated With Mortality in Patients With Cirrhosis Independent of Other Extrahepatic Organ Failures. Clin Gastroenterol Hepatol. 2017;15:565–574.e4. - PubMed
LinkOut - more resources
Full Text Sources

