

No Evidence for Distinct Transcriptomic Subgroups of Devil Facial Tumor Disease (DFTD)
- PMID: 40177324
- PMCID: PMC11961399
- DOI: 10.1111/eva.70091
No Evidence for Distinct Transcriptomic Subgroups of Devil Facial Tumor Disease (DFTD)
Abstract
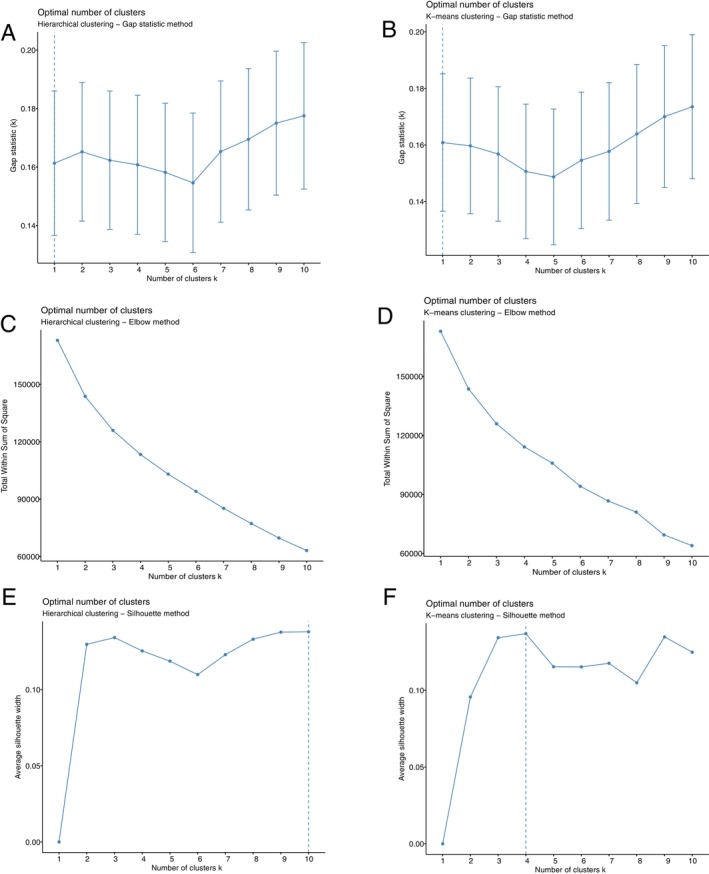
Contagious cancers represent one of the least understood types of infections in wildlife. Devil Facial Tumor Disease (comprised of two different contagious cancers, DFT1 and DFT2) has led to an 80% decline in the Tasmanian devil (Sarcophilus harrisii ) population at the regional level since it was first observed in 1996. There are currently no treatment options for the disease, and research efforts are focused on vaccine development. Although DFT1 is clonal, phylogenomic studies have identified different genetic variants of the pathogen. We postulated that different genetic strains may have different gene expression profiles and would therefore require different vaccine components. Here, we aimed to test this hypothesis by applying two types of unsupervised clustering (hierarchical and k-means) to 35 DFT1 transcriptomes selected from the disease's four major phylogenetic clades. The two algorithms produced conflicting results, and there was low support for either method individually. Validation metrics, such as the Gap statistic method, the Elbow method, and the Silhouette method, were ambiguous, contradictory, or indicated that our dataset only consisted of a single cluster. Collectively, our results show that the different phylogenetic clades of DFT1 all have similar gene expression profiles. Previous studies have suggested that transcriptomic differences exist between tumours from different locations. However, our study differs in that it considers both tumor purity and genotypic clade when analysing differences between DFTD biopsies. These results have important implications for therapeutic development, as they indicate that a single vaccine or treatment approach has the potential to be effective for a large cross-section of DFT1 tumors. As one of the largest studies to use transcriptomics to investigate phenotypic variation within a single contagious cancer, it also provides novel insight into this unique group of diseases.
Keywords: contagious cancer; unsupervised clustering; wildlife disease.
© 2025 The Author(s). Evolutionary Applications published by John Wiley & Sons Ltd.
Conflict of interest statement
Benefit‐sharing statement: This study complies with benefit sharing under the Convention on Biological Diversity.The authors declare no conflicts of interest.
Figures


Similar articles
-
Mesenchymal plasticity of devil facial tumour cells during in vivo vaccine and immunotherapy trials.Immunol Cell Biol. 2021 Aug;99(7):711-723. doi: 10.1111/imcb.12451. Epub 2021 Mar 21. Immunol Cell Biol. 2021. PMID: 33667023
-
Two of a kind: transmissible Schwann cell cancers in the endangered Tasmanian devil (Sarcophilus harrisii).Cell Mol Life Sci. 2020 May;77(9):1847-1858. doi: 10.1007/s00018-019-03259-2. Epub 2019 Aug 2. Cell Mol Life Sci. 2020. PMID: 31375869 Free PMC article.
-
Automated Analysis of PD1 and PDL1 Expression in Lymph Nodes and the Microenvironment of Transmissible Tumors in Tasmanian Devils.Immunol Invest. 2023 Nov;52(6):661-680. doi: 10.1080/08820139.2023.2217845. Epub 2023 Jun 2. Immunol Invest. 2023. PMID: 37267050
-
Curse of the devil: molecular insights into the emergence of transmissible cancers in the Tasmanian devil (Sarcophilus harrisii).Cell Mol Life Sci. 2020 Jul;77(13):2507-2525. doi: 10.1007/s00018-019-03435-4. Epub 2020 Jan 3. Cell Mol Life Sci. 2020. PMID: 31900624 Free PMC article. Review.
-
Devil Facial Tumours: Towards a Vaccine.Immunol Invest. 2019 Oct;48(7):719-736. doi: 10.1080/08820139.2019.1624770. Epub 2019 Jun 4. Immunol Invest. 2019. PMID: 31161832 Review.
References
-
- Adolfsson, A. , Ackerman M., and Brownstein N. C.. 2019. “To Cluster, or Not to Cluster: An Analysis of Clusterability Methods.” Pattern Recognition 88: 13–26.
-
- Andrews, S. 2010. “Babraham Bioinformatics.” Babraham Institute, Cambridge, United Kingdom.
LinkOut - more resources
Full Text Sources
Research Materials
Miscellaneous
