. 2025 Mar 19:45:101056.
doi: 10.1016/j.lana.2025.101056. eCollection 2025 May.

Inequalities in paediatric hospitalisations for costly and prevalent conditions in Ontario, Canada: a population-based cohort study

Collaborators, Affiliations

Inequalities in paediatric hospitalisations for costly and prevalent conditions in Ontario, Canada: a population-based cohort study

Peter J Gill et al. Lancet Reg Health Am. .

Abstract

Background: Identifying inequalities is important for informing research, and policy efforts to reduce health disparities. This study measured the inequalities in hospitalisations for the costly and prevalent conditions in hospitalised children using association estimates.

Methods: Population-based cohort study using health administrative databases in Ontario, Canada between 2014 and 2019. The hospitalisation rate was determined for the costly and prevalent conditions in children. Hospitalisation inequalities by four equity stratifiers (material resources, rurality, sex, and immigrant status) were quantified using rate difference (RD), rate ratio (RR), and ratio of excess to total hospitalisation rate. Multivariable logistic regression analyses were also conducted.

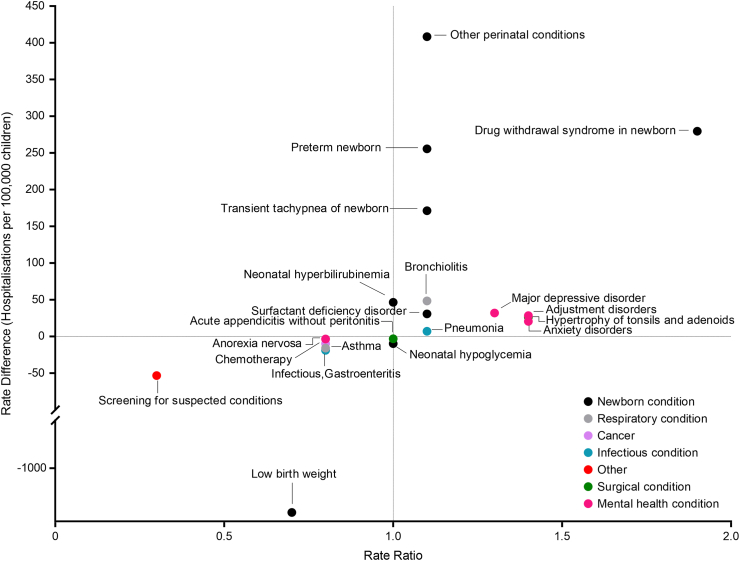
Findings: In a population of 3·7 million children (median age 7·0 years, Interquartile range: 1·0-12·0), there were 612,597 hospitalisations. Large inequalities comparing children among least versus most resourced quintile was observed in low birth weight (RD: 1,823·3 hospitalisations per 100,000 children, 95% CI: 1,662·7, 1,983·9). Conditions with large inequalities comparing rural versus urban areas included low birth weight (RD: -1,833·2 hospitalisations per 100,000, 95% CI: -2,012·8, -1,653·6); and drug withdrawal syndrome in newborn (RR: 1·9, 95% CI: 1·7, 2·1; adjusted odds ratio (aOR): 1·4, 95% CI: 1·2, 1·5). Conditions with large inequalities comparing males versus females included low birth weight (RD: -888·3 hospitalisations per 100,000, 95% CI: -992·5, -784·02); and anorexia nervosa (RR: 0·08, 95% CI: 0·07, 0·10; aOR: 0·1, 95% CI: 0.1, 0.1). Conditions with large inequalities comparing non-refugee immigrants versus non-immigrants included major depressive disorder (RR: 2·8, 95% CI: 2·7, 2·9), and comparing refugees versus non-immigrants included drug withdrawal syndrome in newborn (RR: 0·09, 95% CI: 0·05, 0·15). Results from multivariable analyses were similar.

Interpretation: Newborn and mental health conditions had the largest inequalities in hospitalisations by the equity stratifiers. Findings from this study can be used to prioritise future health equity research to reduce health inequalities.

Funding: PSI Foundation.

Keywords: Health inequalities; Hospitalisation; Immigrant status; Paediatric; Rurality; Sex; Socioeconomic status.


Conflict of interest statement

Dr. Gill has received grants from the Canadian Institute of Health Research (CIHR), the PSI Foundation, and The Hospital for Sick Children. Dr. Cohen is a member of the Committee to Evaluate Drugs which provides advice to Ontario's Ministry of Health on Public Drug Policy. All other authors declare no conflict of interest.

Figures

Fig. 1
Fig. 1
Inequalities in the hospitalisation rate by material resources for the 15 most costly and 15 most prevalent conditions. The figure presents the inequalities in hospitalisation rate by material resources using rate difference and rate ratio. A rate difference greater than 0 indicates that the hospitalisation rate for the condition was greater in the least resourced quintile than the most resourced quintile, and a rate difference lesser than 0 indicates that the hospitalisation rate was lower in the least resourced quintile than the most resourced quintile. A rate ratio greater than 1 indicates that the hospitalisation rate for the condition was greater in the least resourced quintile than the most resourced quintile, while a rate ratio lesser than 1 indicates that the rate was lower in least resourced quintile than the most resourced quintile. Conditions with the largest inequalities (i.e., have high rate difference and rate ratio) will be those in the top-right and bottom-left areas of the panels.
Fig. 2
Fig. 2
Inequalities in the hospitalisation rate by rurality for the 15 most costly and 15 most prevalent conditions. The figure presents the inequalities in hospitalisation rate by rurality using rate difference and rate ratio. A rate difference greater than 0 indicates that the hospitalisation rate for the condition was greater in children residing in rural compared to urban areas, and a rate difference lesser than 0 indicates that the hospitalisation rate was lower in rural compared to urban areas. A rate ratio greater than 1 indicates that the hospitalisation rate for the condition was greater in children residing in rural versus urban areas, while a rate ratio lesser than 1 indicates that the rate was lower in rural compared to urban areas. Conditions with the largest inequalities (i.e., have high rate difference and rate ratio) will be those in the top-right and bottom-left areas of the panels.
Fig. 3
Fig. 3
Inequalities in the hospitalisation rate by sex for the 15 most costly and 15 most prevalent conditions. The figure presents the inequalities in hospitalisation rate by sex using rate difference and rate ratio. A rate difference greater than 0 indicates that the hospitalisation rate for the condition was greater in males than females, and a rate difference lesser than 0 indicates that the hospitalisation rate was lower in males than females. A rate ratio greater than 1 indicates that the hospitalisation rate for the condition was greater in males than females, while a rate ratio lesser than 1 indicates that the rate was lower in males than females. Conditions with the largest inequalities (i.e., have high rate difference and rate ratio) will be those in the top-right and bottom-left areas of the panels.
Fig. 4
Fig. 4
Inequalities in the hospitalisation rate comparing non-refugee immigrants to non-immigrants for the 15 most costly and 15 most prevalent conditions. The figure presents the inequalities in hospitalisation rate by immigrant status using rate difference and rate ratio. A rate difference greater than 0 indicates that the hospitalisation rate for the condition was greater in non-refugee immigrants compared to non-immigrants, and a rate difference lesser than 0 indicates that the hospitalisation rate was lower in non-refugee immigrants compared to non-immigrants. A rate ratio greater than 1 indicates that the hospitalisation rate for the condition was greater in non-refugee immigrants versus non-immigrants, while a rate ratio lesser than 1 indicates that the rate was lower in non-refugee immigrants versus non-immigrants. Conditions with the largest inequalities (i.e., have high rate difference and rate ratio) will be those in the top-right and bottom-left areas of the panels.
Fig. 5
Fig. 5
Inequalities in the hospitalisation rate comparing refugees to non-immigrants for the 15 most costly and 15 most prevalent conditions. The picture presents the inequalities in hospitalisation rate by immigrant status using rate difference and rate ratio. A rate difference greater than 0 indicates that the hospitalisation rate for the condition was greater in refugees compared to non-immigrants, and a rate difference lesser than 0 indicates that the hospitalisation rate was lower in refugees compared to non-immigrants. A rate ratio greater than 1 indicates that the hospitalisation rate for the condition was greater in refugees versus non-immigrants, while a rate ratio lesser than 1 indicates that the rate was lower in refugees versus non-immigrants. Conditions with the largest inequalities (i.e., have high rate difference and rate ratio) will be those in the top-right and bottom-left areas of the panels.

References

    1. World Health Organization . World Health Organization; Geneva: 2013. Handbook on Health Inequality Monitoring: With a Special Focus on Low- and Middle-income Countries.
    1. National Center for Health Statistics (US) National Center for Health Statistics; Hyattsville (MD): 2016. Health, United States, 2015: with special feature on racial and ethnic health disparities.https://www.ncbi.nlm.nih.gov/books/NBK367640/
    1. National Academies of Sciences, Engineering, and Medicine; Health and Medicine Division; Board on Population Health and Public Health Practice; Committee on Community-Based Solutions to Promote Health Equity in the United States . National Academies Press (US); Washington, DC: 2017. Communities in Action: Pathways to Health Equity. - DOI
    1. World Health Organization . World Health Organization; Geneva: 2017. National Health Inequality Monitoring: A Step-by-step Manual. Licence: CC BY-NC-SA 3.0 IGO.
    1. Welch V., Petticrew M., Tugwell P., et al. PRISMA-Equity 2012 extension: reporting guidelines for systematic reviews with a focus on health equity. PLoS Med. 2012;9 doi: 10.1371/journal.pmed.1001333. - DOI - PMC - PubMed

LinkOut - more resources